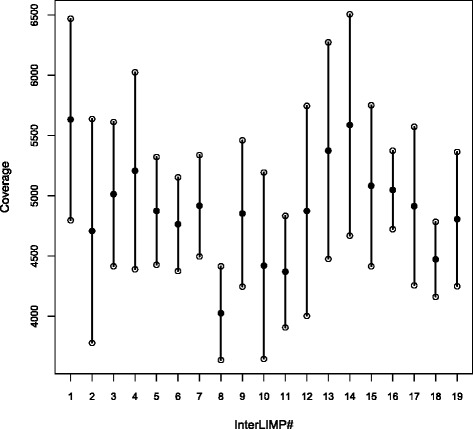
Fig. 4.

Single read coverage of interLIMP regions. For each interLIMP, the filled dot indicates the average coverage, and the lower and upper open dots represent the values of average ± standard deviation. InterLIMP #i corresponds to the region in-between LIMPs #i and i + 1, and interLIMP #19 is the region between LIMPs #19 and 1 (see Table 2)
