. 2015 Jun 25;4:e06266. doi: 10.7554/eLife.06266

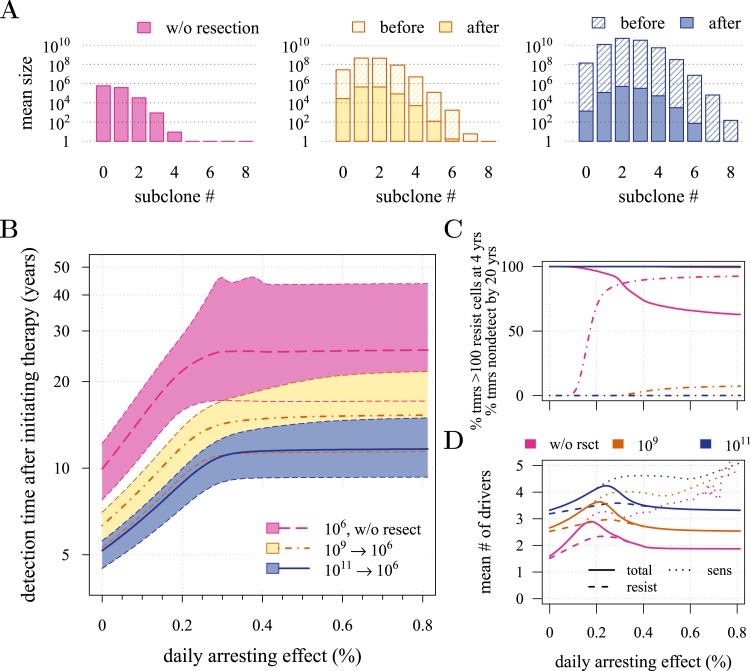
Figure 3. Effects of preventive and post-diagnostic interventions against tumours consisting of 1 million cells.

(A) The distribution of mean sizes of subclones (hatched bars = before removal and solid bars = post removal). (B) The time distribution of cases in which either intervention type fails to control the tumour below the detection threshold after 50 years (thick line = median, filled area with dashed boundaries = 90% CIs) for different constant treatment intensities. (C) The percentage of cases where the tumour consists of less than 100 resistant cells at 4 years after treatment commences (solid lines), and the percentage of cases where tumour size is below the detection threshold 20 years after the measure begins (dashed-and-dotted lines). (D) The mean number of accumulated drivers within a tumour at the time of detection. Parameter values as in Table 1.

DOI: http://dx.doi.org/10.7554/eLife.06266.010

Figure 3.

Figure 3—figure supplement 1. Effects of preventive and post-diagnostic interventions against tumours consisting of 10,000 cells.

Figure 3—figure supplement 1.

Same as Figure 3, except interventions against 104 cancer cells. (A) The distribution of mean sizes of subclones for different constant treatment intensities (hatched bars = before removal and solid bars = post removal). (B) The time distribution of cases in which either intervention type fails to control the tumour below the detection threshold after 50 years (thick lines = medians, shaded areas with dashed boundaries = 90% CIs). (C) The percentage of cases when a tumour consists of less than 100 resistant cells at 4 years post-resection (solid lines) and the percentage of cases when tumour sizes are below the detection threshold 20 years after the measure commences (dashed-and-dotted lines). (D) The mean number of accumulated drivers within a tumour at the time of detection. Parameter values as in Table 1.
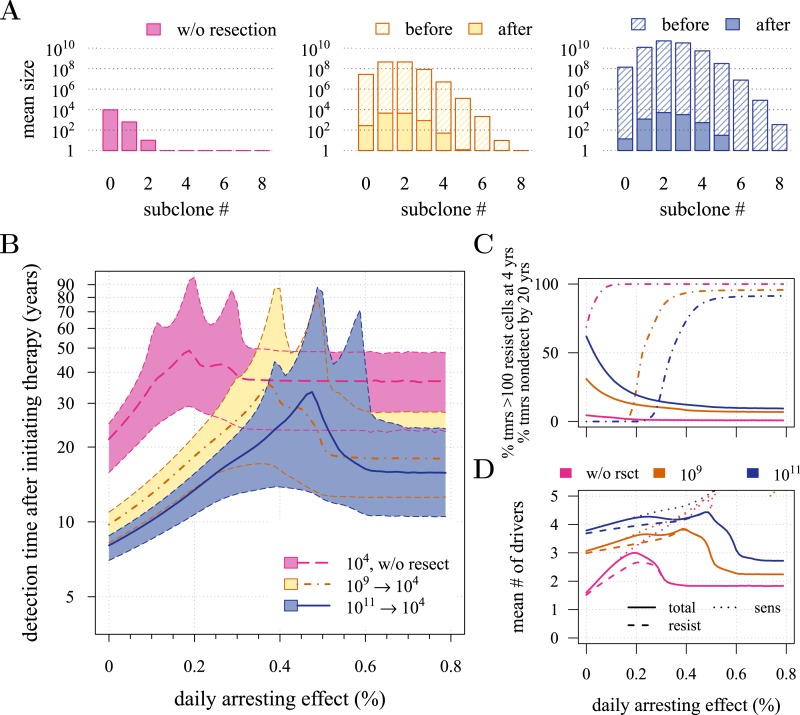
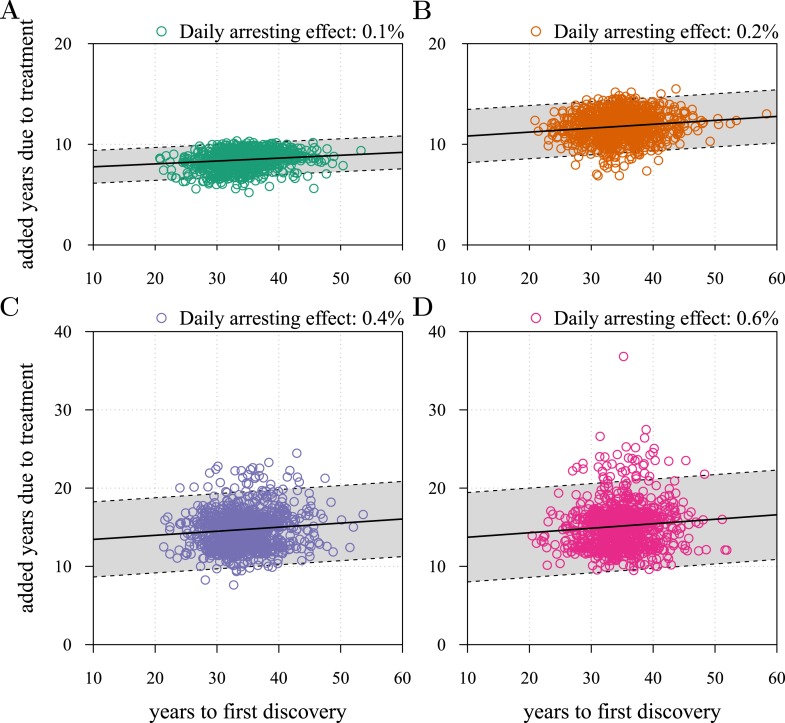
Figure 3—figure supplement 2. Time to first discovery as a predictor of post-diagnostic treatment success.

Figure 3—figure supplement 2.

Time to tumour relapse following resection as function of the time it takes for the initial cancer cell to attain 109 cells (i.e., the point at which the tumour is discovered, resected, and treatment begins). Each dot represents a numerical simulation from the yellow distribution in Figure 3B (only 1,000 simulation results out of 106are shown). Four different treatment levels are considered. Black solid line is a simple linear regression, and grey area with dashed boundaries indicates extrapolation of high and low bounds accounting for 95% of observations (prediction interval). The fitted linear regression model gives an intercept of 7.5 years, a slope of 1.6° and R2 of 0.024 in (A), 10.4 years, 2.2° and R2 of 0.017 in (B), 12.9 years, 3.0° and R2 of 0.009 in (C), and 13.1 years, 3.3° and R2 of 0.008 in (D). Parameters as in Table 1.
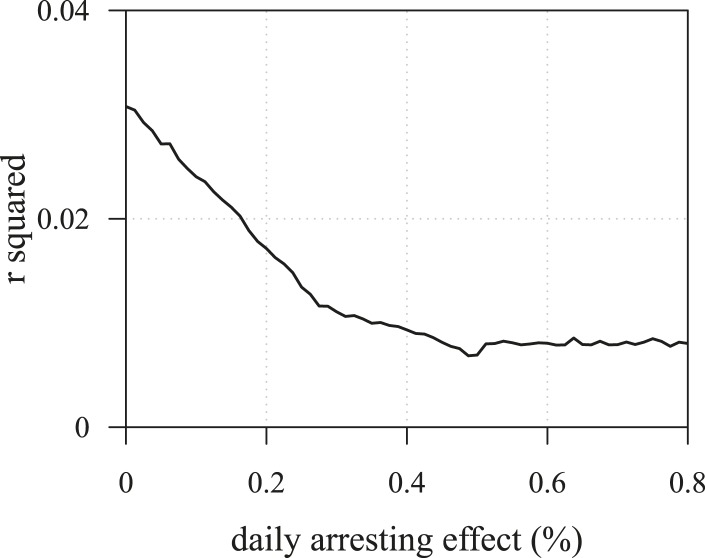
Figure 3—figure supplement 3. The R2 of regressions from numerical experiments for different treatment levels of time to tumour relapse following resection as function of the mean number of drivers in a resected tumour.

Figure 3—figure supplement 3.

Time to tumour discovery is generally more predictive of post-diagnostic therapeutic outcome for lower treatment levels. See Figure 3—figure supplement 2 for details.
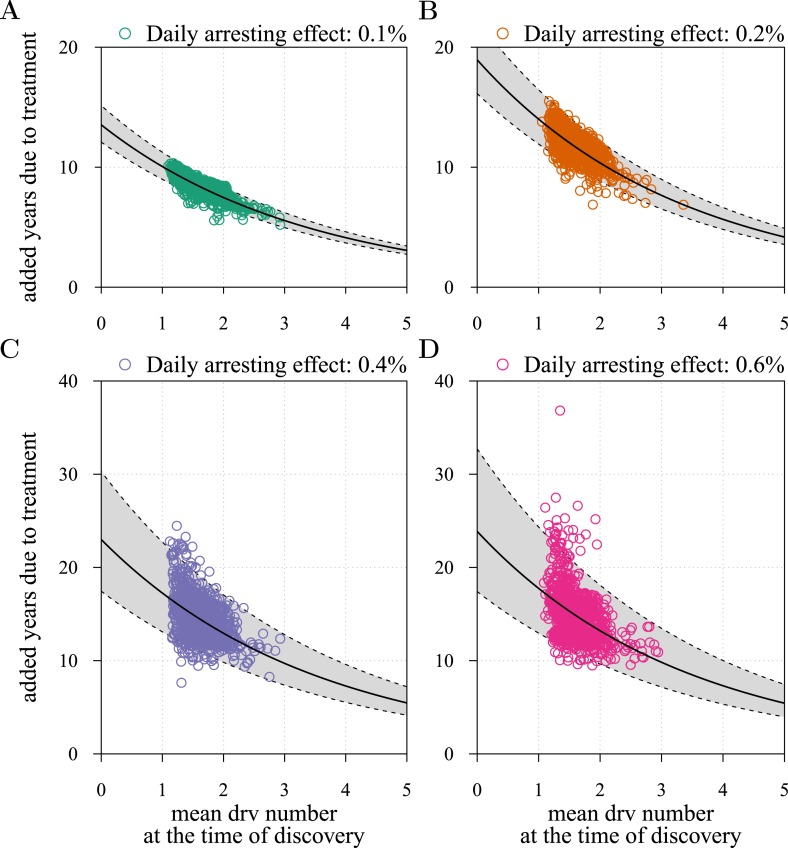
Figure 3—figure supplement 4. Mean number of additionally accumulated drivers in resected tumour as a predictor of post-diagnostic treatment success.

Figure 3—figure supplement 4.

The fitted negative exponential regression model y = ae-bx gives a = 13.5 years, b = 0.3 and R2 = 0.696 in (A), 18.95 years, 0.3 and R2 = 0.537 in (B), 23.0 years, 0.29 and R2 = 0.262 in (C), and 23.9 years, 0.3 and R2 = 0.224 in (D). See Figure 3—figure supplement 2 for details.
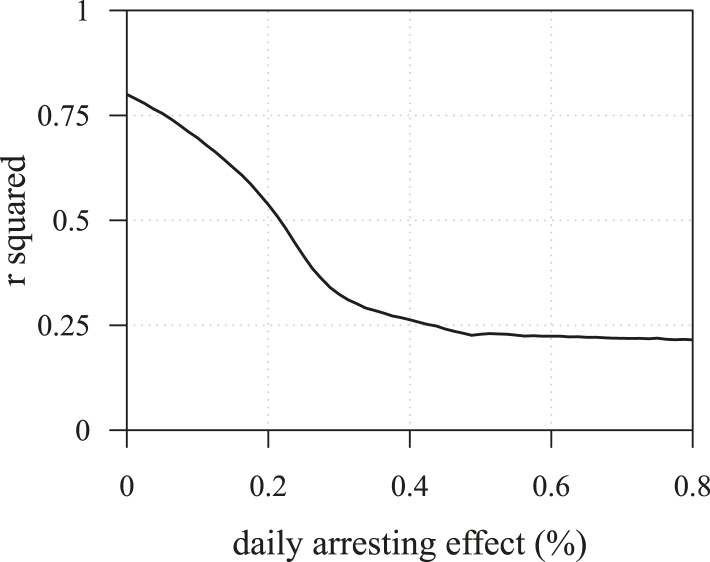
Figure 3—figure supplement 5. The R2 of regressions from numerical experiments for different treatment levels of time to tumour relapse following resection as function of the mean number of drivers in a resected tumour.

Figure 3—figure supplement 5.

Time to tumour discovery is more predictive of post-diagnostic therapeutic outcome for lower treatment levels. See Figure 3—figure supplement 4 for details.