. 2015 Jun 25;4:e06266. doi: 10.7554/eLife.06266

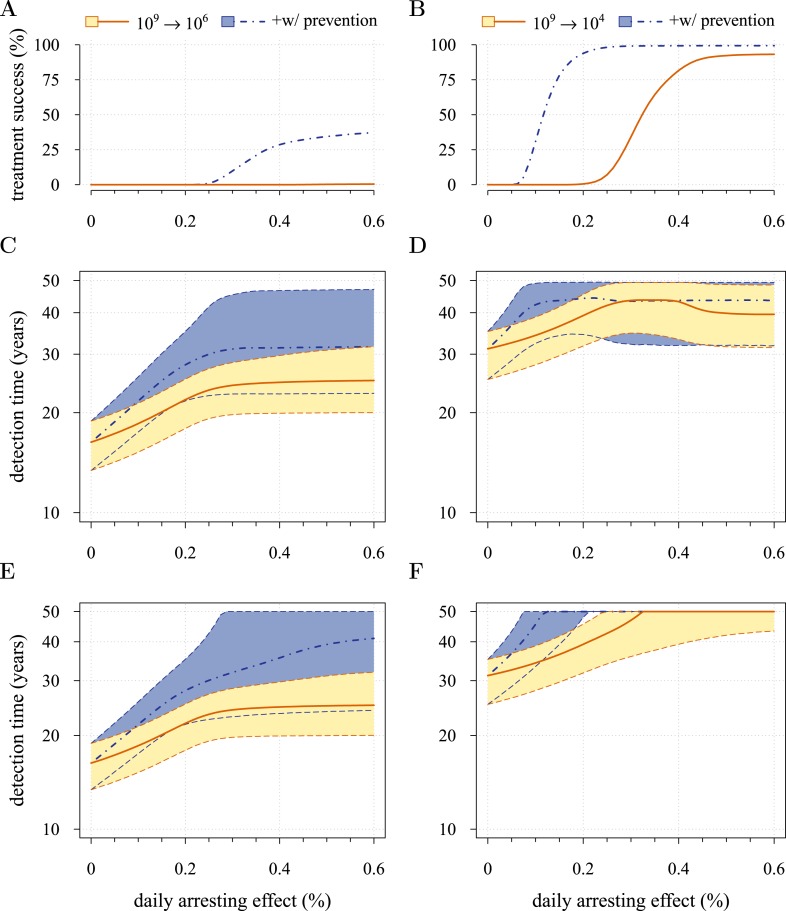
Figure 5. Comparison of preventive (blue lines and shading) and post-diagnostic (red lines, yellow shading) interventions.

Tumours are either treated at M0 = 106 cells (left panels) or M0 = 104 cells (right panels). (A, B) Probability of treatment success, defined as the proportion of cases where the tumour remains undetected (either extinct or below 109 cells) by 50 years after the initial lesion of M0 cells. (C, D) Distribution of times to relapse for treatment failures. (E, F) Distribution of detection times for all cases including relapsed tumours and tumours remaining undetected prior to and after 50 years (detection times are assigned to 50 years in the latter case). Parameters as in Table 1. See Figure 3 for details.

DOI: http://dx.doi.org/10.7554/eLife.06266.017

Figure 5.

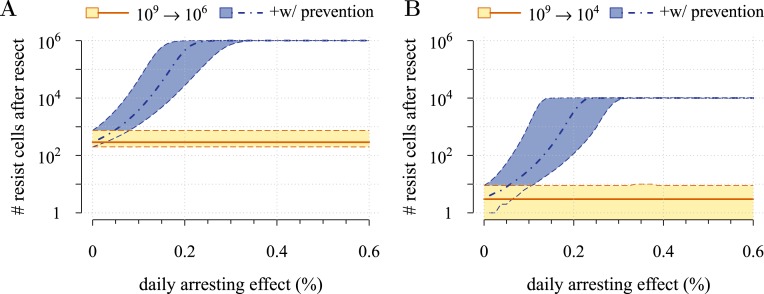
Figure 5—figure supplement 1. Resistant cell populations after initial failure.

Figure 5—figure supplement 1.

Tumours are either treated at M0 = 106cells (A) or M0 = 104cells (B). Red lines and yellow shading = population following resection. Parameter values as in Table 1.
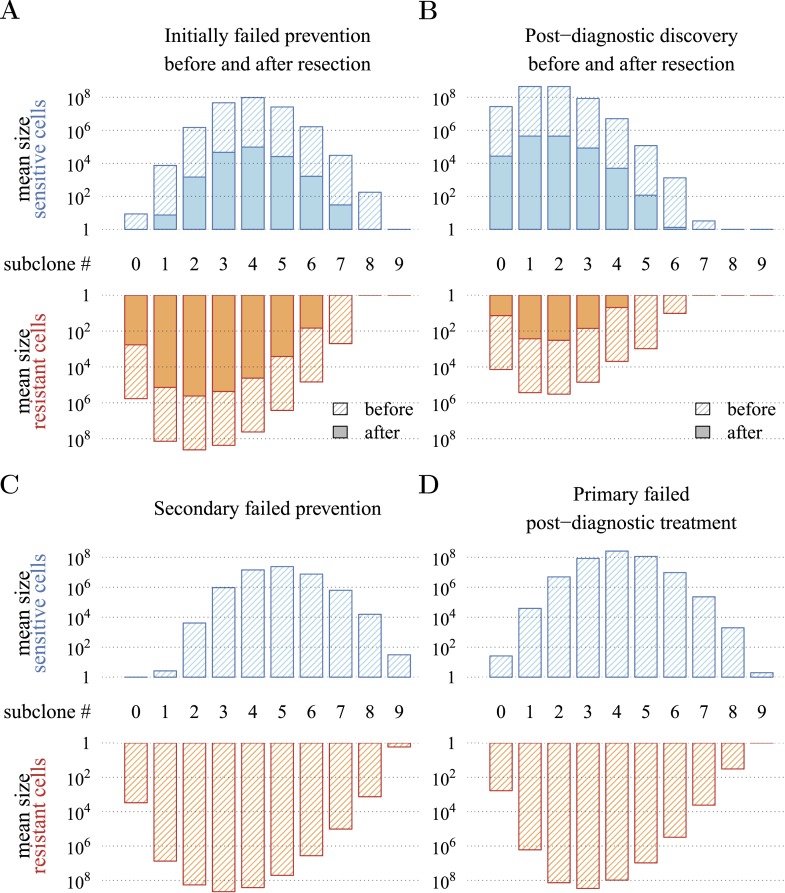
Figure 5—figure supplement 2. Distribution of mean sizes of subclones.

Figure 5—figure supplement 2.

(A) Cases where a tumour is detected and resected following prevention. (B) Cases where a tumour is detected and resected with no prevention. (C) Cases of relapse following resection and secondary treatment to initially failed prevention. (D) Cases of relapse following resection and primary treatment in cases where there was no prevention. Hatched bars indicate cell numbers in the tumour and solid bar numbers after resection and 106 residual or metastatic cells. Daily arresting level assumed to be 0.25%. Parameter values as in Table 1.
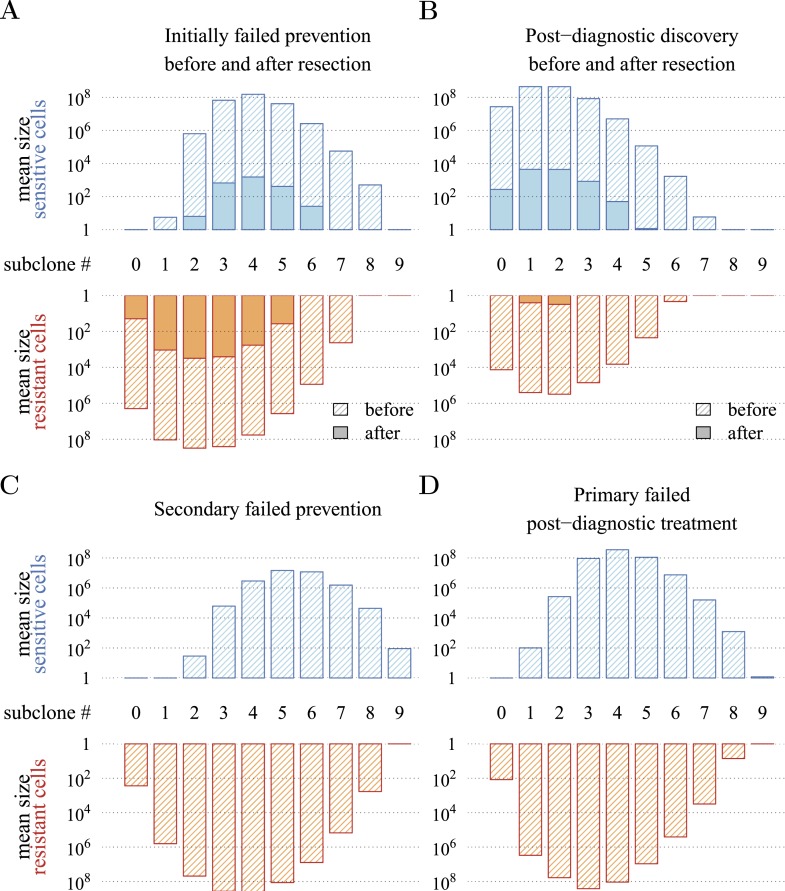
Figure 5—figure supplement 3. Distribution of mean sizes of subclones.

Figure 5—figure supplement 3.

Same as Figure 5—figure supplement 2, except M0 is 104 cancer cells.