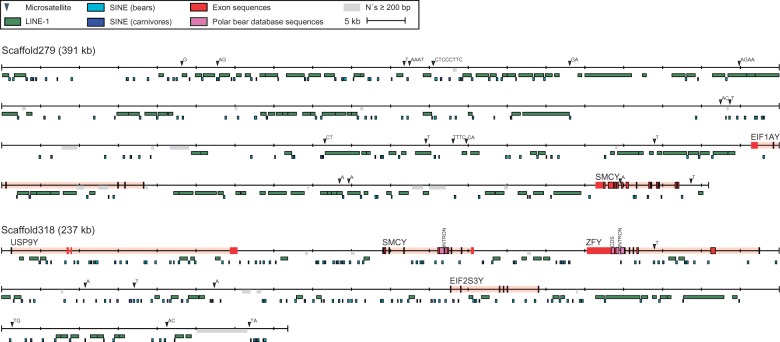
Fig. 3.—
Annotations of Y-linked scaffolds 297 and 318. Exons homologous to mouse and human are shown in red. Previously published Y-linked polar bear sequences are shown in pink. The repeat unit of each microsatellite is indicated and regions with greater than 200 bp of consecutive “N” are highlighted in gray. Due to the high abundance, only placental mammalian non-LTR retrotransposons ≥500 bp (LINEs) and ≥100 bp (SINEs) were plotted. The maps of additional scaffolds are shown in supplementary figure S3, Supplementary Material online.

