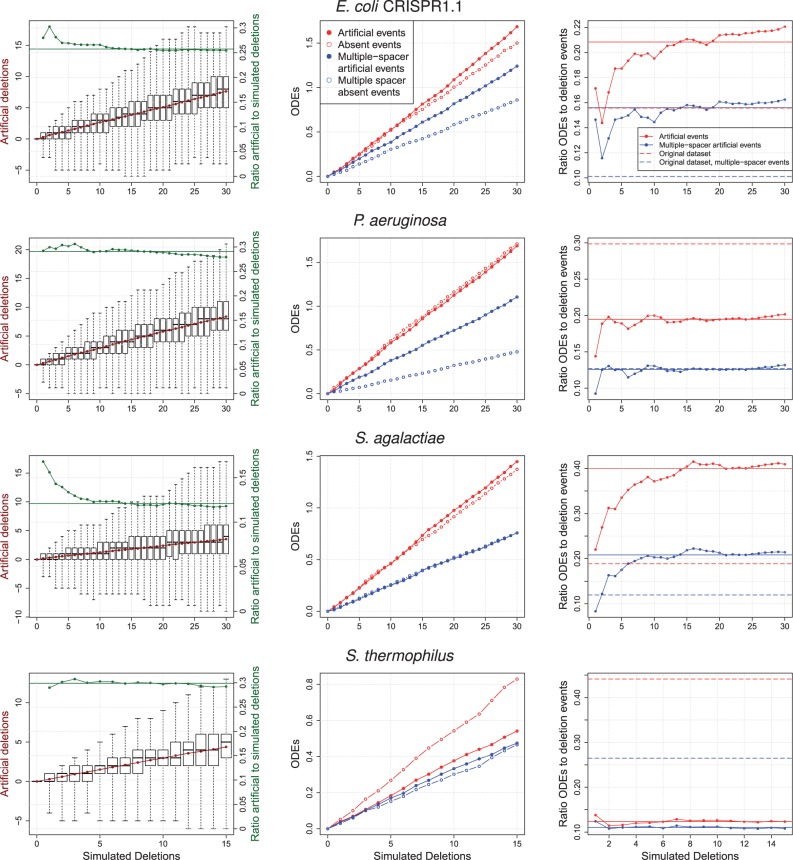
Fig. 6.—
Estimation of deletion effects from 1,000 perturbed replicates. Left: Distribution of artificial deletions observed after introducing simulated deletions. The number of inferred deletions (left y axis) is calculated as the number of deletions inferred minus the number of deletions inferred for the original data set. The boxplot whisker range includes the outlier points. Middle: Artificial ODEs are present in the perturbed data set and not present in the original data set (see Materials and Methods for details). Absent events are present in the original data set and missing in the perturbed data set. Right: Ratio of mean number of artificial ODEs to deletion events. The median of each line is given as a thicker horizontal line. For comparison, the ratio from the original data set is shown. For the remaining E. coli data sets, see supplementary figure S3, Supplementary Material online.

