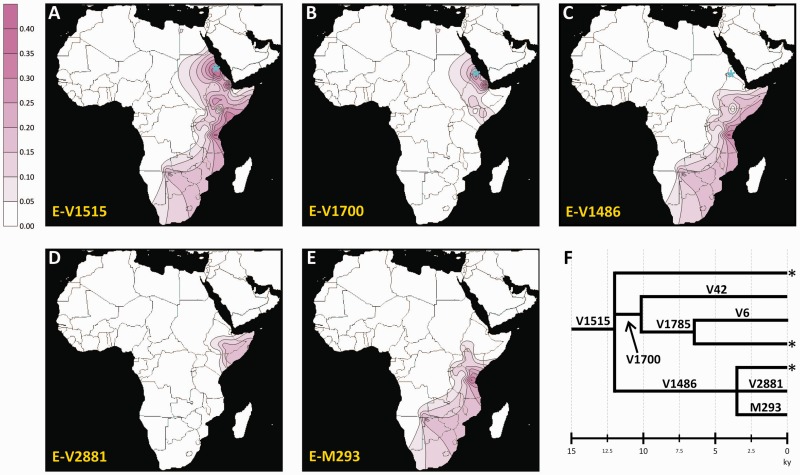
Fig. 3.
—Maps of the observed frequencies for haplogroup E-V1515 and its major subhaplogroups. (A) Haplogroup E-V1515, (B) haplogroup E-V1700, (C) haplogroup E-V1486, (D) haplogroup E-V2881, (E) haplogroup E-M293, (F) simplified phylogeny of E-V1515, showing the estimated age of the nodes (ky). Place of sampling of chromosomes carrying rare paragroups E-V1515*, E-V1785*, and E-V1486* is shown as blue asterisks in panels (A), (B), and (C), respectively. The sampling locations for the populations used in this analysis are shown in supplementary figure S5, Supplementary Material online.

