
Figure 6.
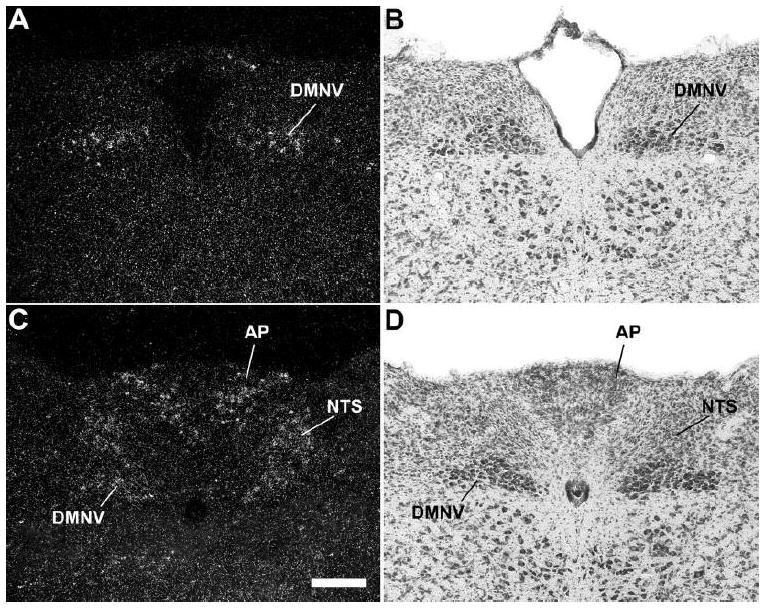
A series of high-power photomicrographs demonstrating GHSR type 1a mRNA expression in the dorsal vagal complex of the mouse. A and C: rostrocaudally-arranged brain sections processed for GHSR mRNA by ISHH. B and D: Nissl-stained brain sections adjacent to those appearing in A and B. See Table 1 for an explanation of abbreviations. The scale bar located in panel C represents 200 μm (and applies to all the panels in this figure).