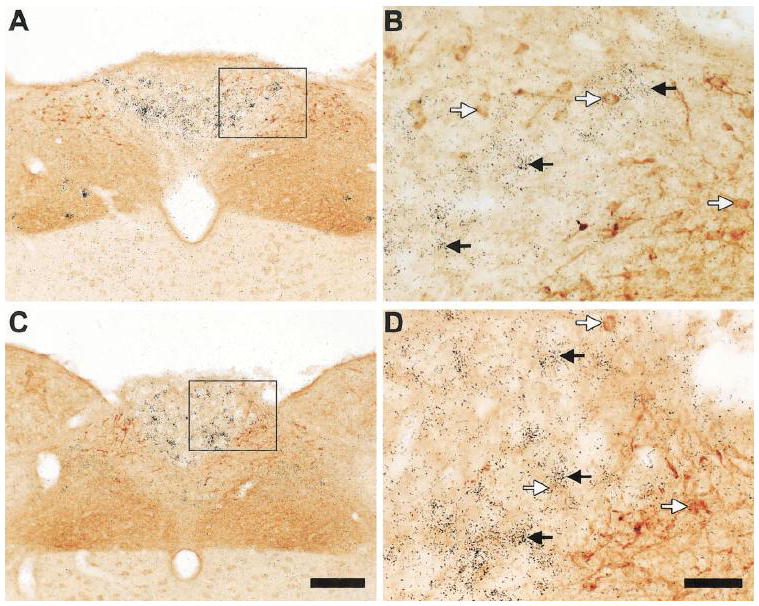
Figure 8.

A series of photomicrographs demonstrating distinct expression patterns for GHSR and cholecystokinin in the dorsal vagal complex of the rat. A and C: rostrocaudally-arranged brain sections through the dorsal vagal complex. CCK-IR cell bodies are stained orange-brown. Cells expressing GHSR type 1a mRNA have overlying black silver granules. The boxed areas in A and C are magnified in B and D. Black arrows indicate examples of neurons singly-labeled with GHSR riboprobe. White arrows indicate examples of neurons singly-labeled with anti-CCK antiserum. The scale bar located in panel C represents 200 μm (and applies to panels A and C); the scale bar located in panel D represents 50 μm (and applies to panels B and D).
