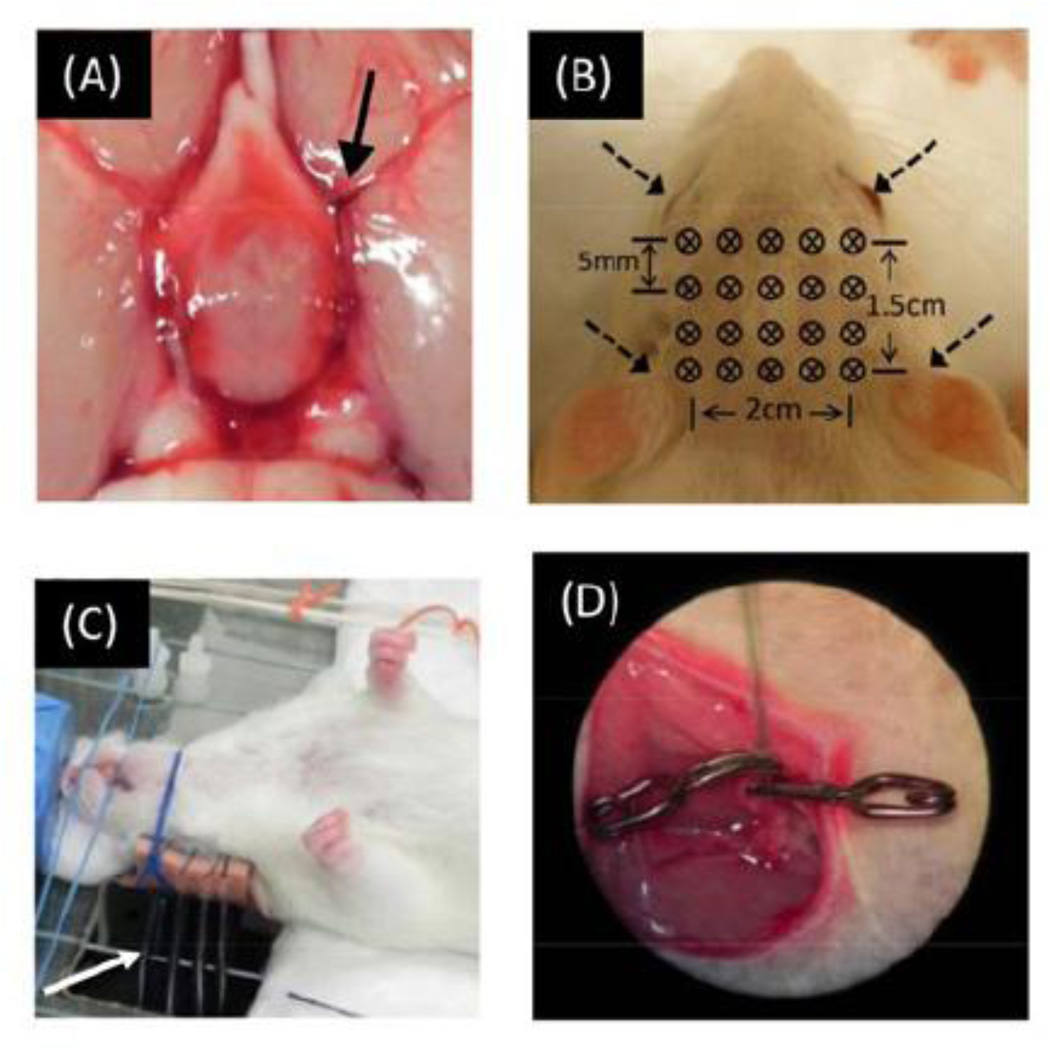
Fig. 1.
(A) Embolism-induced MCAO. Clots (indicated by arrow) were delivered by catheter and stayed at MCA bifurcation. (B) Optode geometry for CW-DOT measurements, including a total of 20 bifurcated fibers. (C) Photograph of experimental setup: It shows that the rat was kept in a supine position and several bifurcated fibers (indicated by white arrow) were placed vertically beneath the animal to contact the rat’s scalp. (D) Catheter was implemented in femoral vein for ICG injection.

