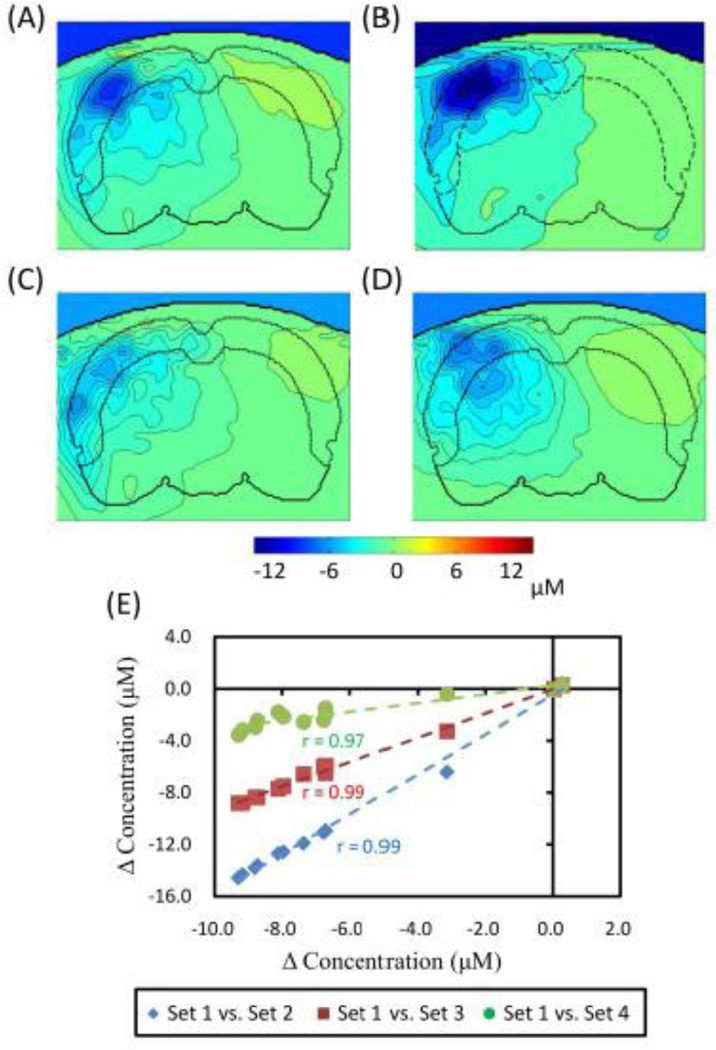
Fig. 14.
Reconstructed images in coronal view of ΔHbO2 from (A) to (D) are reconstructed by different sets of optical properties. Images (C) and (D) were obtained using the same optical properties but (D) was modeled with only one-layer. (E) It shows scatter plots for comparison of ΔHbO2 among four sets of optical properties given in ROI-2. X-axis marks ΔHbO2 values obtained by using set 1 background optical properties, while Y-axis labels ΔHbO2 obtained by other sets of background optical properties.

