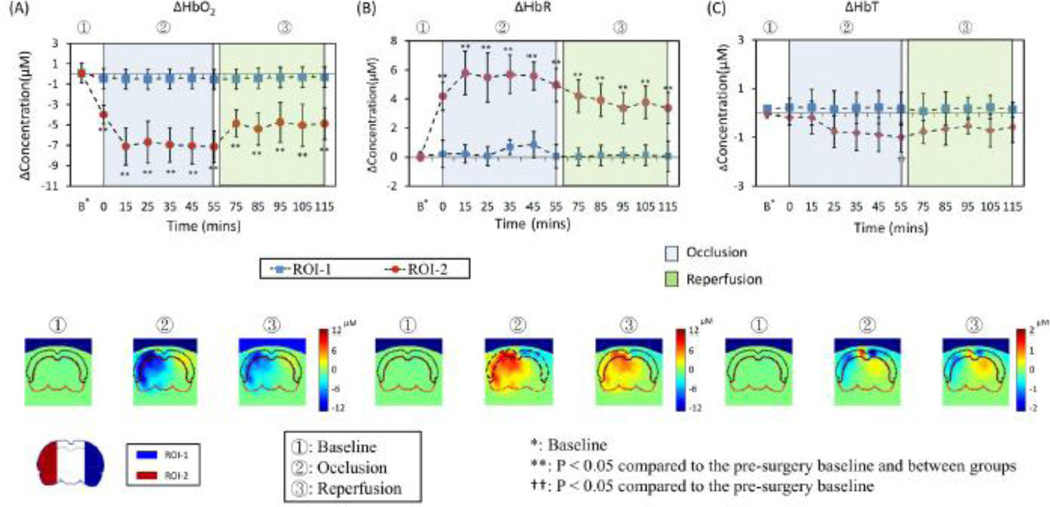
Fig. 8.
Upper row shows the time tracers of (A) ΔHbO2, (B) ΔHbR and (C) ΔHbT in two ROIs for protocol G-Ino-ICG. Every data point is presented as mean ± SD (standard deviation). Bottom row shows the respective coronal views of reconstructed images sliced across the center of the probe array, as marked in Fig. 6(B), during three representative time points: baseline (t = 0 min), during occlusion (t = 35 min), and after reperfusion (t = 95 min), respectively. On the bottom left corner of the figure, two ROIs are replotted from Fig. 7 for easy ROI recognition.

