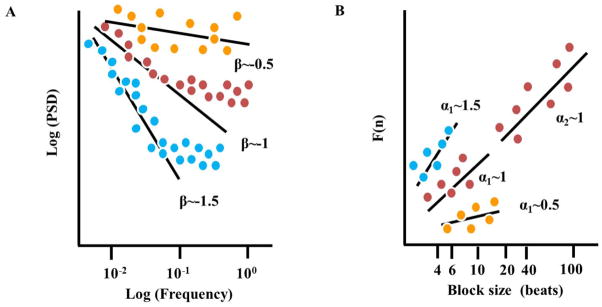
Figure 3. Analytic methods of fractal-like behavior.

Schematic illustration of (A) the linear function derived from a log-log plot (slope β) of the power spectral analysis (PSD, calculated from Fourier analysis of heart rate intervals) vs. frequency, (B) the short and long-term linear relationship (slope α1 and α2, respectively) of the amplitude of detrended fluctuations (F(n)), calculated from heart rate intervals vs. the block size n (in beats), on a log-log scale. The dots illustrate experimental data. Increase in the slope implies decrease in signal complexity while increase in the slope implies a random signal.
