
FIGURE 3.
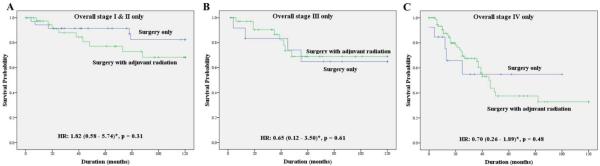
Disease-specific survival (DSS) comparing the surgery only group to the adjuvant radiation group stratified by stage. (A) Comparing the surgery only group to the adjuvant radiation group among patients with stage I and II disease (hazard ratio [HR], 1.82; 95% confidence interval [CI], 0.58–5.74*; p = .31). (B) Comparing the surgery only group to the adjuvant radiation group among patients with stage III disease (HR, 0.65; 95% CI, 0.12–3.50*; p = .61). (C) Comparing the surgery only group to the adjuvant radiation group among patients with stage IV disease (HR, 0.70; 95% CI, 0.26–1.89*; p = .48). *Hazard ratio calculated based on Cox regression model after adjusting for age, sex, race, and anatomic site. [Color figure can be viewed in the online issue, which is available at wileyonlinelibrary.com.]