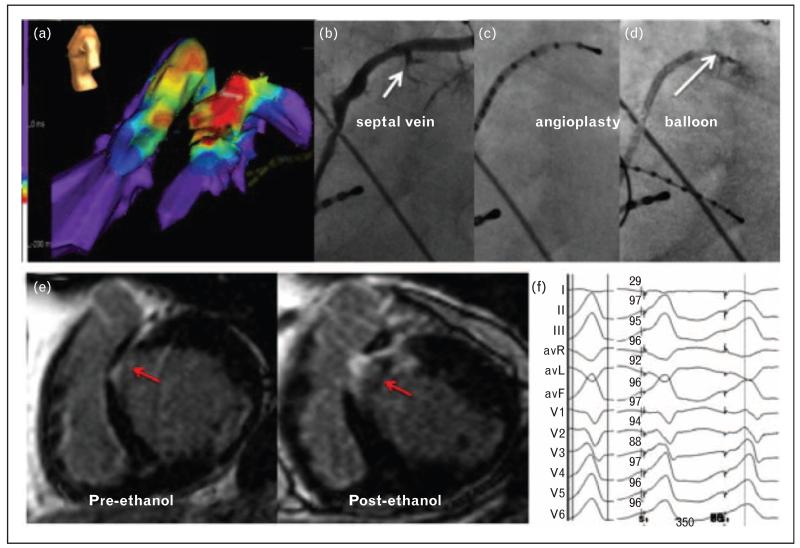
FIGURE 3.
Coronary venous mapping and ethanol ablation of VT. (a) Activation maps of VT in the AIV and in RV and LV cavities. The earliest activation site is shown coming from within the AIV. (b) Selective venogram of the AIV showed two septal branches. (c) The AIV was then cannulated with a decapolar catheter, and the distal poles were inserted into the septal branch. Pace maps were obtained that matched the QRS morphology of the clinical tachycardia as shown in (f). (d) The septal branch was cannulated with an angioplasty wire and occluded with a 1.5 6 mm balloon. Ethanol (98%, 1 cm3) was then injected into the septal vein. (e) CMR at baseline showed a pre-existing midmyocardial septal area of delayed enhancement (pre-ethanol) that was significantly expanded after ethanol injection. (f) Twelve-lead electrocardiogram of the spontaneous VT (left) and paced QRS from the septal branch of the AIV (right), along with automated calculation of the percentage of similarity by using Bard software (Bard Electrophysiology, Boston, Massachusetts, USA). AIV, anterior interventricular vein; CMR, cardiac magnetic resonance; LV, left ventricle; RV, right ventricle; VT, ventricular tachycardia (from Baher et al. [41]).

