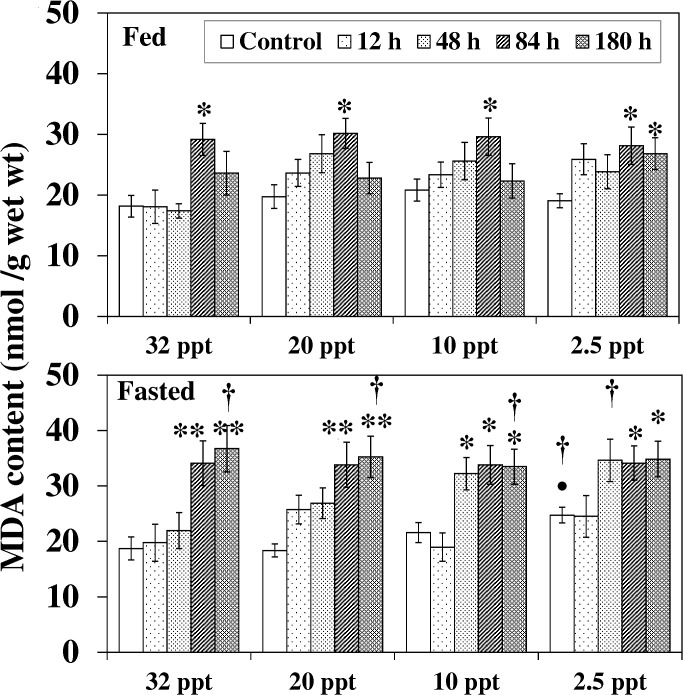
Fig 3. Malondialdehyde content.
Malondialdehyde (MDA) content (nmol/g) in liver of fed and fasted fish during acclimation to different salinities and exposure to HEA. Values are mean ± S.E. Asterisk (*) indicates a significant difference between the ammonia exposed fish and its respective control at each salinity (*P < 0.05; **P < 0.01), bullet (•) indicates a significant difference between experimental salinities (20 ppt -2.5 ppt) and the 32 ppt-acclimated fish at the same sampling period (• P < 0.05), dagger (†) denotes the significant difference between fed fish and its respective fasted fish counterpart († P < 0.05).

