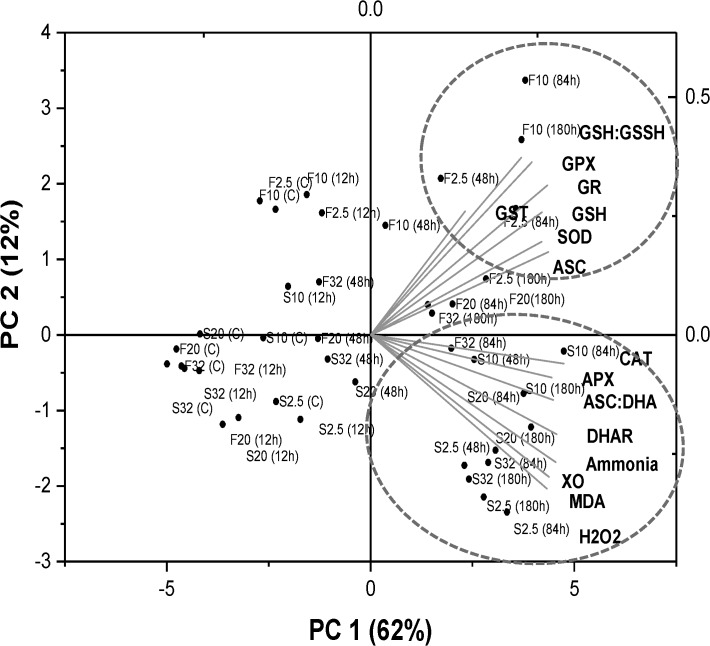
Fig 10. Principal Component Analysis.
Principal Component Analysis (PCA) representing the contribution of biochemical parameters for fed (F) and starved (S) fish. The variable coordination is presented by the complementary cases analysis showing distribution of salinity acclimation groups (32, 20, 10, and 2.5 ppt) and HEA exposure (C, 12 h, 48 h, 84 h, 180 h) in the (PC 1 ×PC 2) coordination plane.

