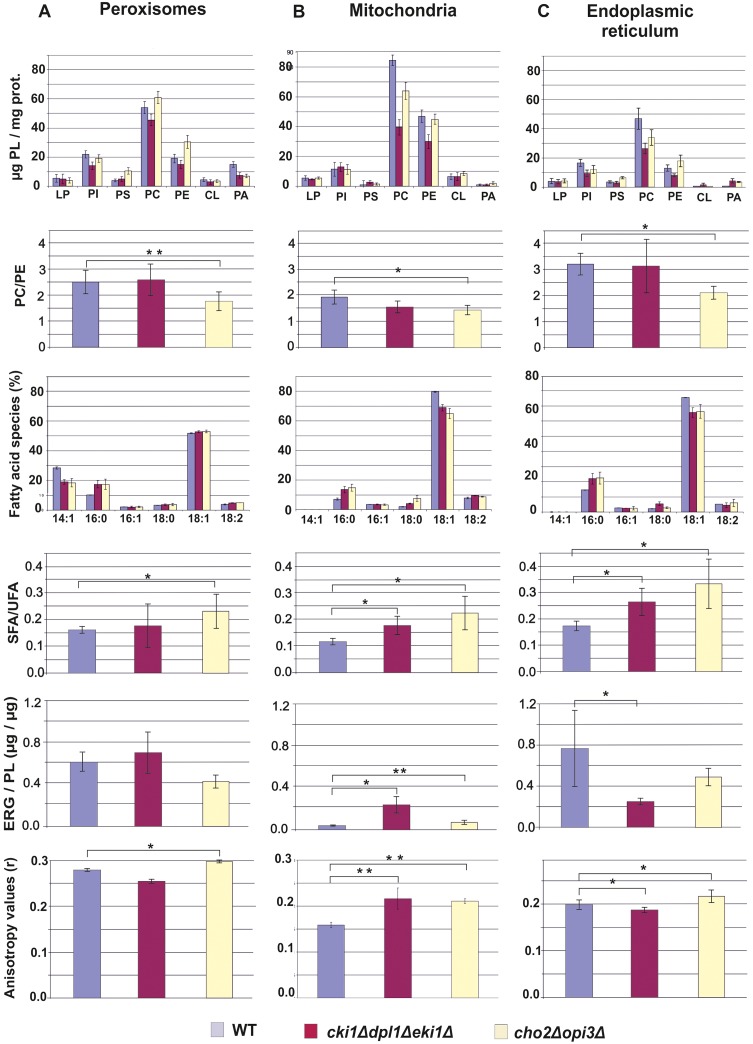
Fig 6. Analysis of organelles from wild type, cho2Δopi3Δ and cki1Δdpl1Δeki1Δ yeast strains.
Yeast strains used were grown on YPO media. Data obtained with isolated peroxisomes (lane A), mitochondria (lane B) and endoplasmic reticulum (lane C) are shown. Line 1: Phospholipid pattern expressed as μg of individual phospholipids per mg protein. LP, lysophospholipids; PI, phosphatidylinositol; PS, phosphatidylserine; PC, phosphatidylcholine; PE, phosphatidylethanolamine; CL, cardiolipin; PA, phosphatidic acid. Line 2: PC to PE ratio in different organelles and strains. Line 3: Fatty acid composition of different organelles and strains. Line 4: Ratio of saturated (SFA) to unsaturated (UFA) fatty acids in different organelles and strains. Line 5: Ergosterol (ERG) to phospholipid (PL) ratio in different organelles and strains. Line 6: Anisotropy values obtained with different organelles and strains. For experimental details see Materials and Methods section. For all experiments two independent biological samples were used which were analyzed 2 to 3 time, each.

