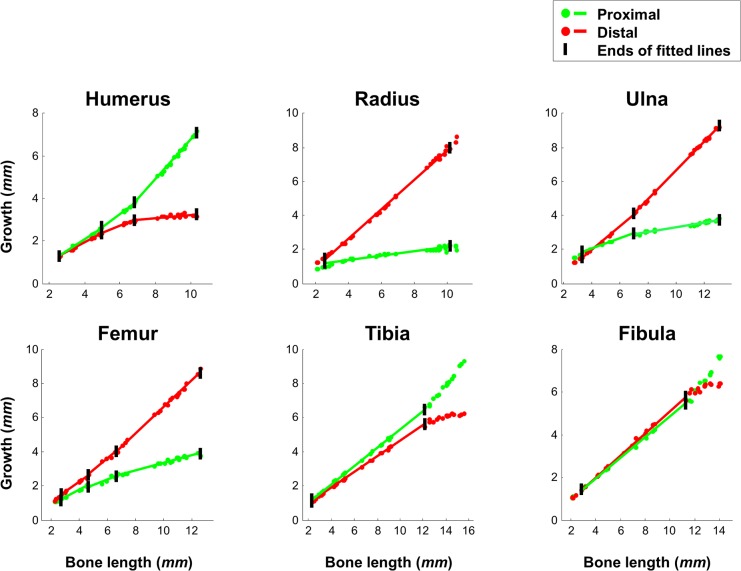
Fig 8. Growth balance remains invariant when stationary elements are present.
Graphs showing growth at the proximal and distal ends of each bone as a function of the total length of the bone. Black vertical tags mark the ends of fitted lines, indicating time points at which an element either becomes stationary or begins to drift (the stationary elements are indicated by gray thick background in Fig 6). Regression analysis shows that at all intervals during which a stationary element is detected, the proximal/distal growth rate balance remains invariable (0.87 ≤ R 2 ≤ 0.99, p-value < 10e-05). Data for this figure are provided in S3 Data.

