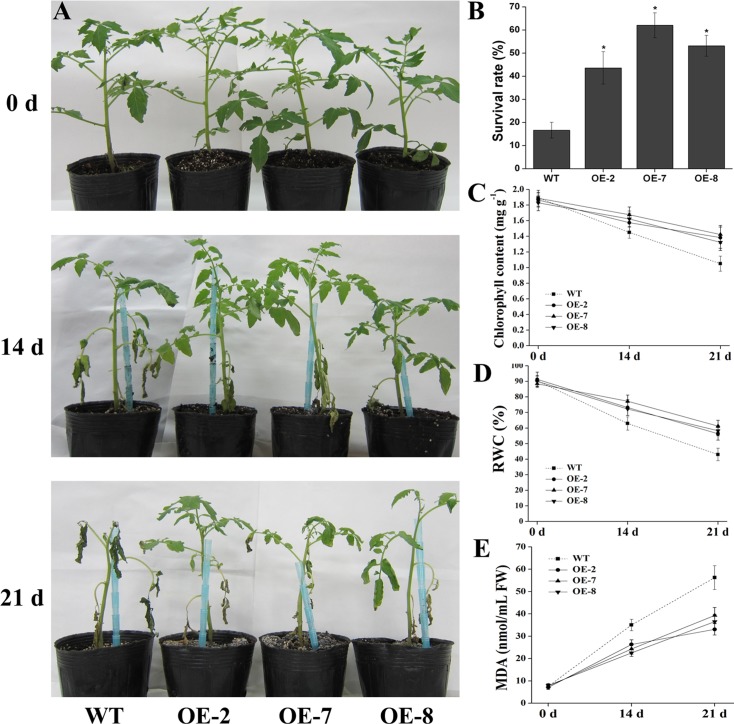
Fig 6. Salt stress tolerance of SlDEAD31-overexpressing plants.
(A) Growth characteristics of WT and transgenic tomato plants at 0, 14 and 21 d after salt stress. 8-week-old plants were irrigated with 200 mL 400 mM NaCl every 72 h from the bottom of the pots. Representative plants are shown. (B) Survival rate of the plants shown after 21 d of salt treatment and 5 d of recovery. Each bar represents an average of eight plants ± SE (n = 3). Asterisks indicate a significant difference between WT and transgenic lines (P<0.05). (C)-(E) Comparisons of chlorophyll content (C), relative water content (RWC, D), and malondialdehyde (MDA) content (E) of WT and transgenic plants at 0, 14 and 21 d after salt stress. Data represent the means ± SE (n = 3).

