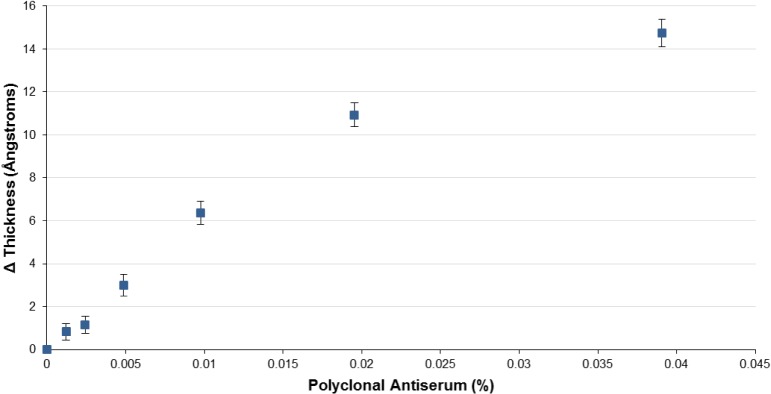
Fig 2. Representative array response to a dilution series of H7 polyclonal antiserum.

Cross-reactivity (non-H3 response) is shown only at the highest concentration tested, but was negligible throughout. Error on each point represents the square root of the sum of squares between the analyte and control group standard deviations for the HA isoforms; N = 1, n = 10.
