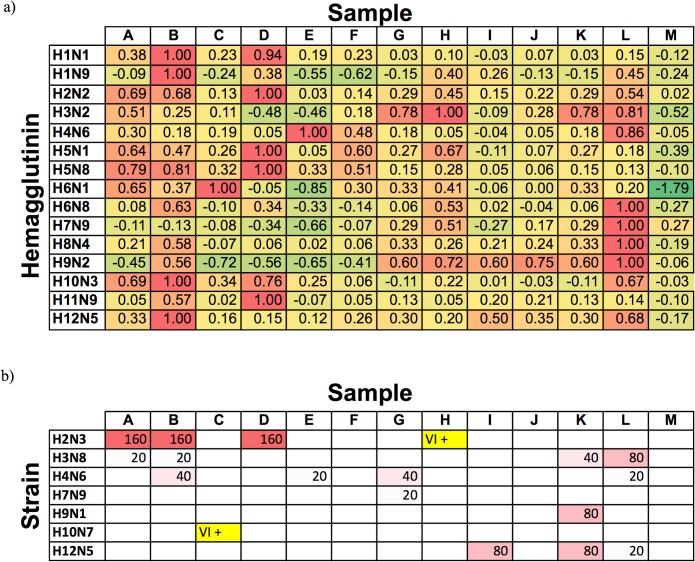
Fig 4. Comparison of HA microarray and selected microneutralization (MN) and virus isolation (VI) results for field samples (mallard).
a) AIR microarray data. Average differences in spot thickness (normalized relative to the strongest response for each antigen) for chips treated with 18% field serum are reported relative to control. Color coding (green = low to red = high) is scaled relative to this maximum response. b) MN results (numbers indicate antibody titer); two samples highlighted in yellow tested positive by VI. Empty cells indicate an antibody titer of < 20.

