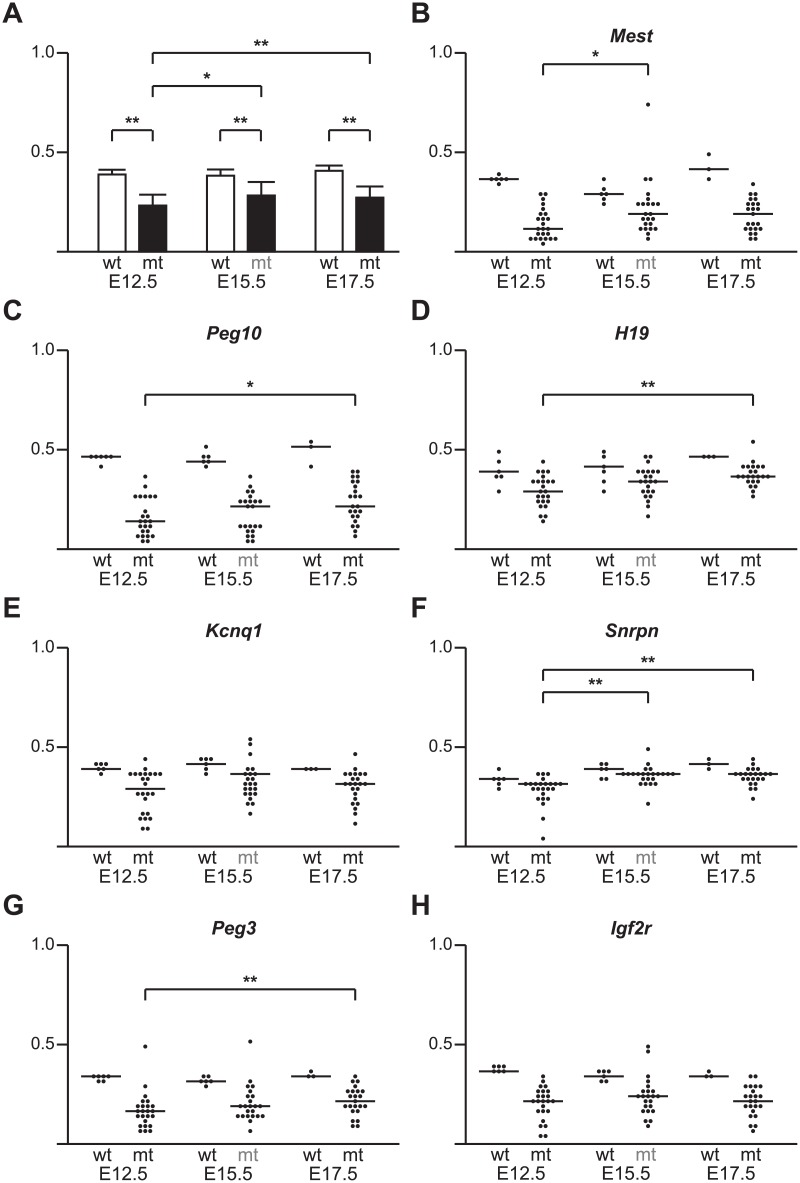
Fig 1. Imprinted gDMD methylation levels in wild-type (wt) and DNMT1o-deficient (mt) placentas across mid gestation (E12.5, E15.5 and E17.5).
(A) Bar graphs showing average mean and standard deviation of total imprinted gDMD methylation of wt (open bars) and mt (filled bars) across mid-gestation. (B-F) Binned scatter plot showing individual wt and mt placentas across mid-gestation and the sample mean for the following imprinted gDMDs: (B) Mest, (C) Peg10, (D) H19, (E) Kcnq1, (F) Snrpn, (G) Peg3 and (H) Igf2r. Small brackets indicate significant differences between gestational age matched sample populations of wt and mt gDMD methylation medians. Larger brackets indicate significant differences between mutant gDMD methylation medians at different gestational ages. * (P<0.01), and **(P<0.001) denote significant differences of mutant median imprinted gDMD methylation compared to wild type, or between gestational ages of mutant sample population by the Rank-sum test.

