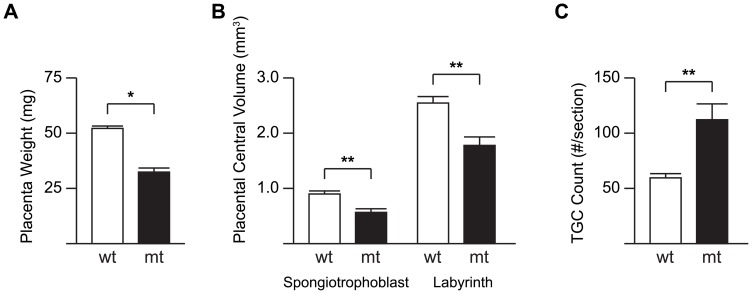
Fig 3. Phenotypic comparison of wild-type (wt) and DNMT1o-deficient (mt) placentas at E12.5.
(A) Measurements of wet placenta weight, (B) Spongiotrophoblast and Labyrinth central volume, and (C) the number of TGCs per slide of a cohort of wt and mt placentas are displayed as open and filled bars respectively. Data are plotted as mean +SEM. *(P<0.05) and **(P<0.005) denote significant differences between wt and mt averages by the Rank-sum test.

