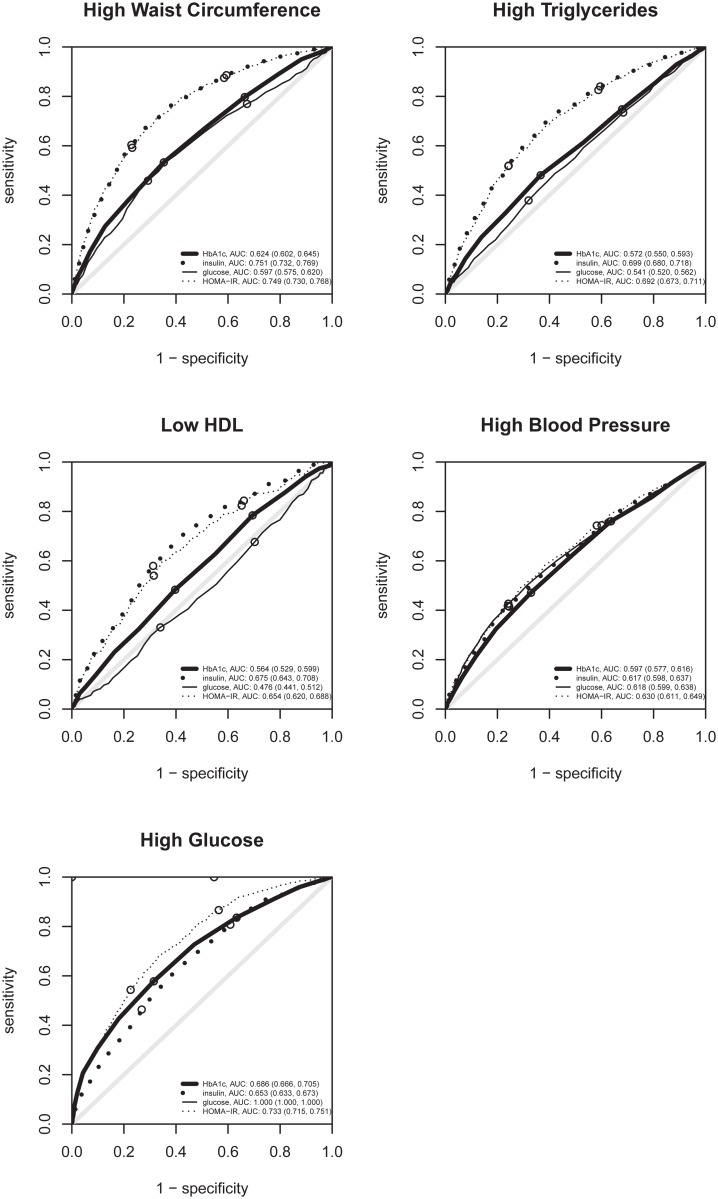
Fig 1. ROC curves of HbA1c, insulin, glycemia and HOMA-IR for metabolic syndrome criteria.
ROC curves for detecting individually each metabolic syndrome criteria. The small circles indicate the sensitivity and specificity when using the tertiles of each variable as cut-offs. For high glucose, the glycemia curve can not be seen as it lies exactly at the left and upper borders.

