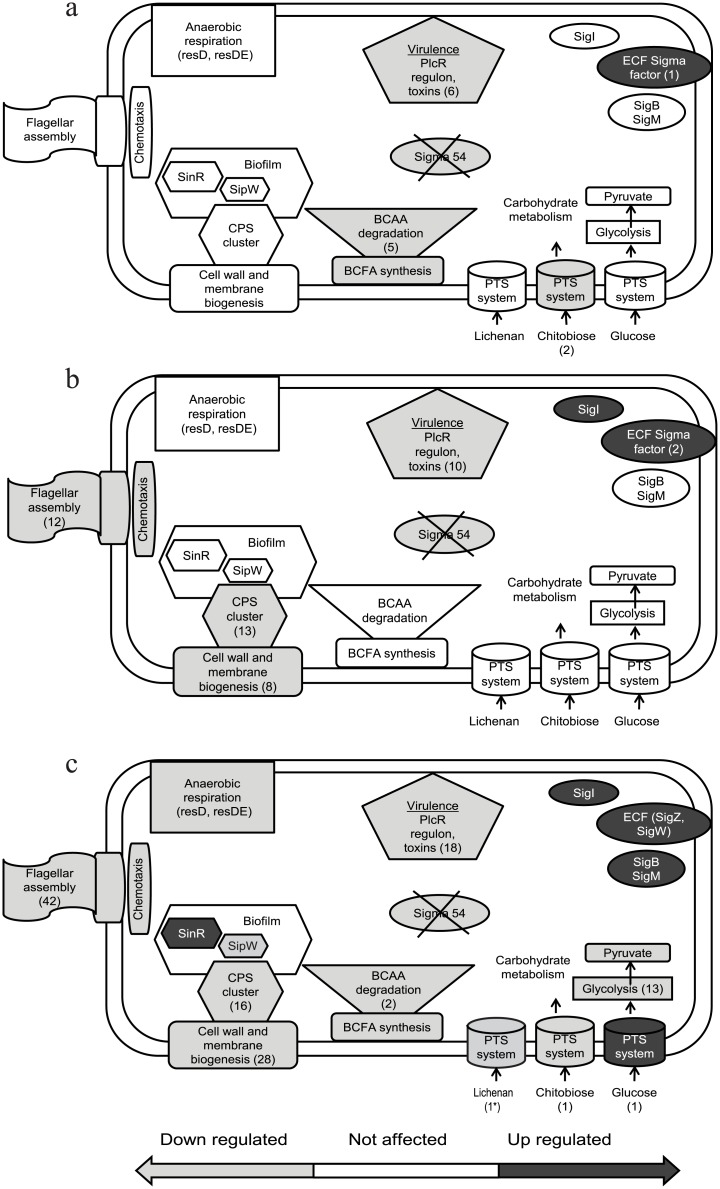
Fig 9. Affected processes in the cell.
Schematic model of cellular processes, based on observed phenotypes combined with affected and complemented genes in the rpoN mutant. a) Aerated growth mid-exponential phase, b) aerated growth end-exponential phase, c) static growth mid-exponential phase. The numbers in (brackets) are the number of genes affected in the given category. Asterisk (*) means the gene was not complemented.

