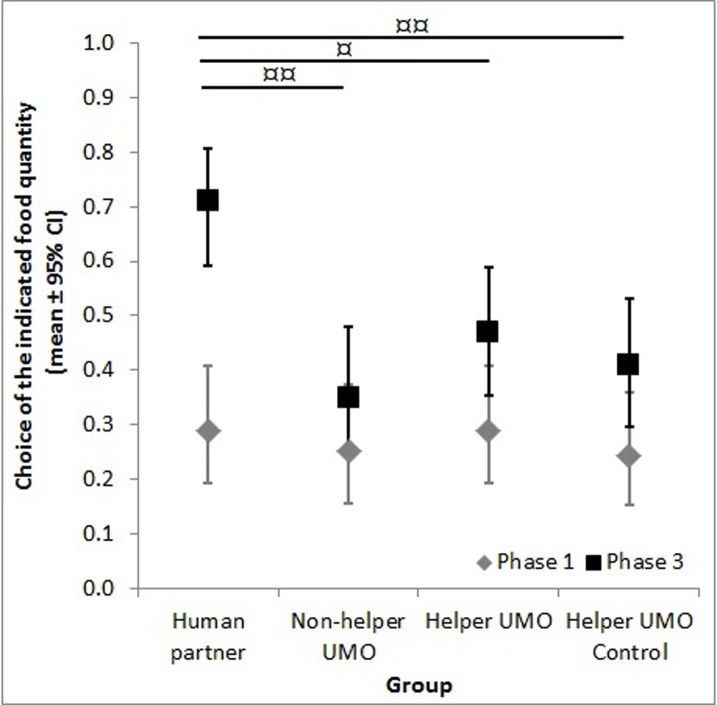
Fig 2. Choice of the small food quantity in Phase 1 and 3.
Data are only from dogs who chose the larger quantity more often (Phase 1) and the partner indicated the small food quantity in Phase 3; * shows the difference between phases, ¤ shows the difference between groups in Phase 3 (* p<0.05, ** p<0.001, ¤ p<0.01, ¤¤ p<0.001).

