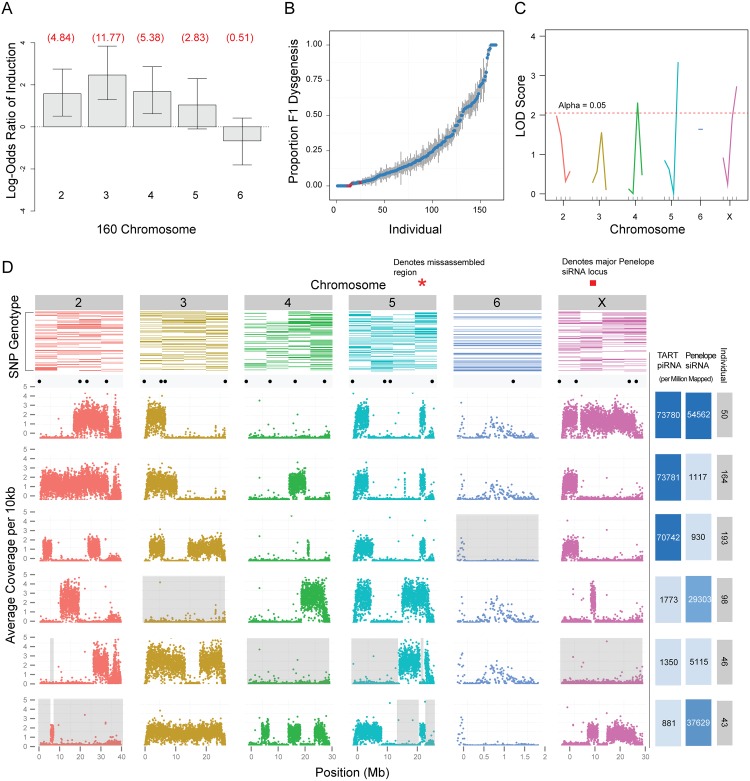
Fig 6. Genetic analysis of zygotic induction and maternal repression of gonadal atrophy.
(A) Induction of sterility by 160 is broadly distributed across the genome, with the exception of chromosome 6 (the dot chromosome). Log odds ratios for probability of induction were estimated by crossing F1 males to strain 9, determining whether F2s had male gonadal atrophy and genotyping F2s to determine the chromosomes inherited from the father. Estimates were determined using a generalized linear model for logistic regression (binomial family with a logit link). Values in red are actual odds ratios. Whiskers are 95% confidence intervals. Chromosome 5 is significant at 0.1 level only. X chromosome is not scored because dysgenesis is scored in males and males do not inherit the X from their fathers (N = 92). (B) Scatterplot showing proportion of dysgenic testes (y axis) observed in the progeny of each F3 female individual (x axis). Red dots indicate F3 females that were selected for whole genome sequencing. (C) Single marker QTL analysis identified 3 putative QTLs: one flanking the centromeres of the 5th and X chromosomes and one of the tested euchromatic regions of the 4th chromosome. (D) Top row: Results from the genotyping assay. Colored rectangles represent the presence of strain 160 SNPs in individuals, ranked from top to bottom (most protective individuals on top). Scatterplots: sequencing results. Each dot represents the average number of base pairs that uniquely mapped to every 10kb of the 160 genome. Valleys indicate regions of strain 9 homozygosity. Black dots above scatterplots show the location of each SNP used for our genotyping assay. Grey background demonstrates that no region of the genome from 160 is necessary to protect against dysgenesis. Right-most columns: Number of piRNAs mapped to TART sequences, per million reads, for each F3 female individual. Color intensity is representative of TART piRNA abundance. Number of 21 nt endo-siRNAs mapped to Penelope sequences, per million 21 nt reads, for each F3 female individual. Color intensity is representative of Penelope endo-siRNA abundance. Red bar indicates position of one of several Penelope endo-siRNA loci on the X.

