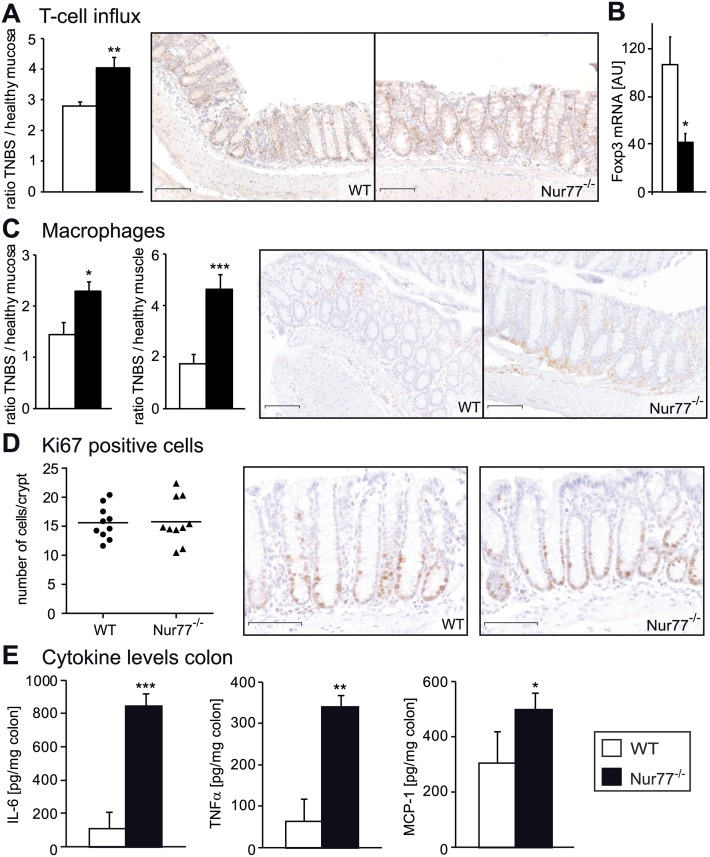
Fig 4. Nur77-/- mice show more macrophage and T-cell influx in TNBS-induced colitis.
The numbers of T-cells in the mucosa were counted and the influx was calculated by taking the ratio of Healthy / TNBS. Representative photomicrographs of sections stained for T-cells (anti-CD3) are shown (A). mRNA was extracted from colon and qPCR was performed for FoxP3 (B). cDNA levels were normalized for 36B4 housekeeping gene expression. Macrophage surface was quantified in the mucosa and the number of macrophages was counted in the muscle. The ratio of Healthy / TNBS was calculated. Representative photomicrographs of sections stained for macrophages (anti-F4/80) are shown (C). The numbers of Ki67 positive cells were counted per crypt and representative photomicrographs are shown (D). Colon lysates were prepared to determine IL-6, TNFα, and MCP-1 levels in the colon (E). A and C Original magnification x100, D x200. Each symbol represents 1 animal. Data are presented as mean±SEM; *p<0.05, **p<0.01, ***p<0.001. Scale bars represent 1mm. nr = number, AU = Arbitrary units, FoxP3 = Forkhead box P3 (marker for regulatory T-cells).

