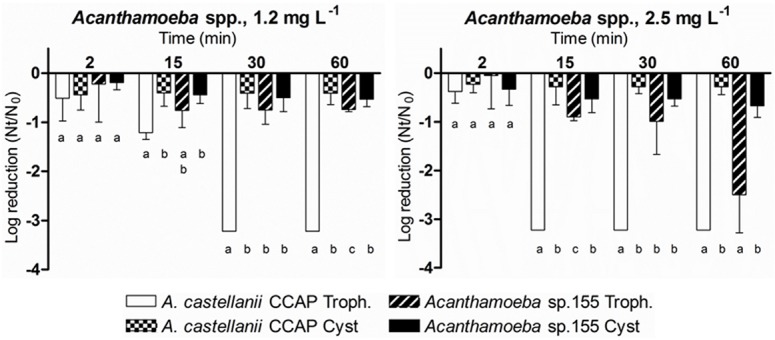
Fig 2. Effect of free chlorine, 1.2 mg L-1 and 2.5 mg L-1, on the inactivation of 2 Acanthamoeba strains treating separately trophozoites and cysts.

Amoebal inactivation was determined using an adaptation of the MPN method. Data are presented as means ± SD (columns and error bars; n = 3). Statistical differences between means within each time point were represented assigning different letters to the bar plot. The same letter was assigned to bars with no significant differences between them. Statistical analyses were performed by ANOVA and pairwise Fisher’s LSD test (p<0.05).
