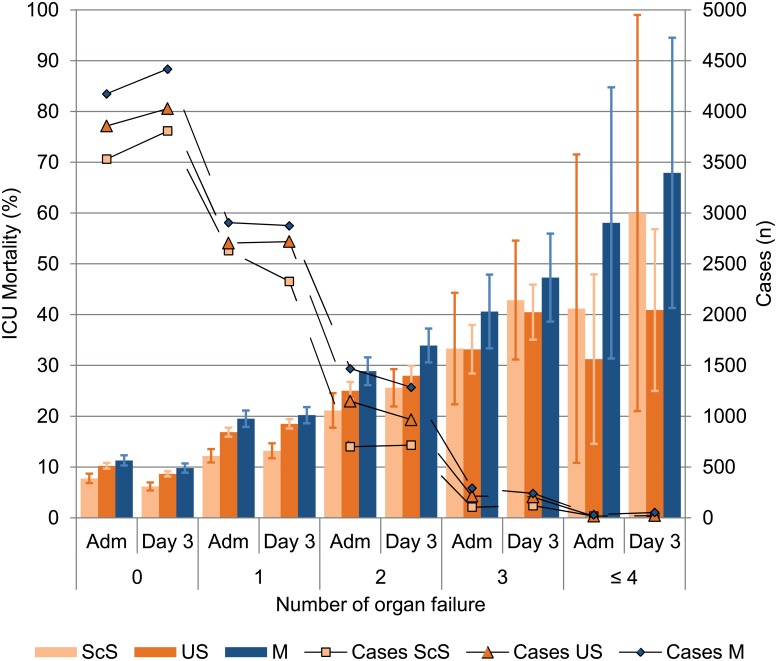
Fig 3. Organ failure on admission and day three of ICU treatment in the ScS-, the US- and the M-patients.
Bars depict the ICU mortality rate of each organ failure (group mean ± 95% CI). Mortality increased with an increasing number of organ failures while the same number of organ failures on day three had a higher mortality rate compared to the day of ICU admission for every type of admission. M patients had higher mortality rates than surgical admitted patients. Lines depict the number of cases with an organ failure. ScS, scheduled surgery; US, unscheduled surgery; M, medical patients; Adm, ICU Admission day; day 3, third day of ICU treatment.

