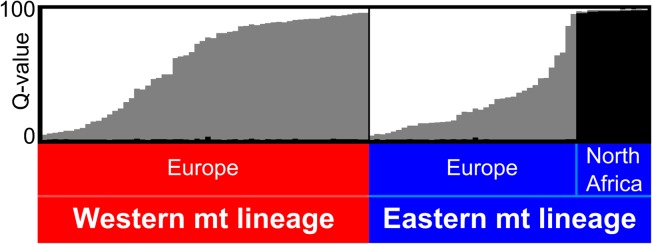
Fig 5. Population structure inferred for K = 3 by the Bayesian clustering analysis.

The analysis was performed from alleles at five microsatellites for 111 P. kuhlii. An admixture model was used and 20 independent runs of Structure were performed in order to calculate a mean membership (Q-value) for each individual. Individuals are represented by vertical bars and sorted by mitochondrial lineage.
