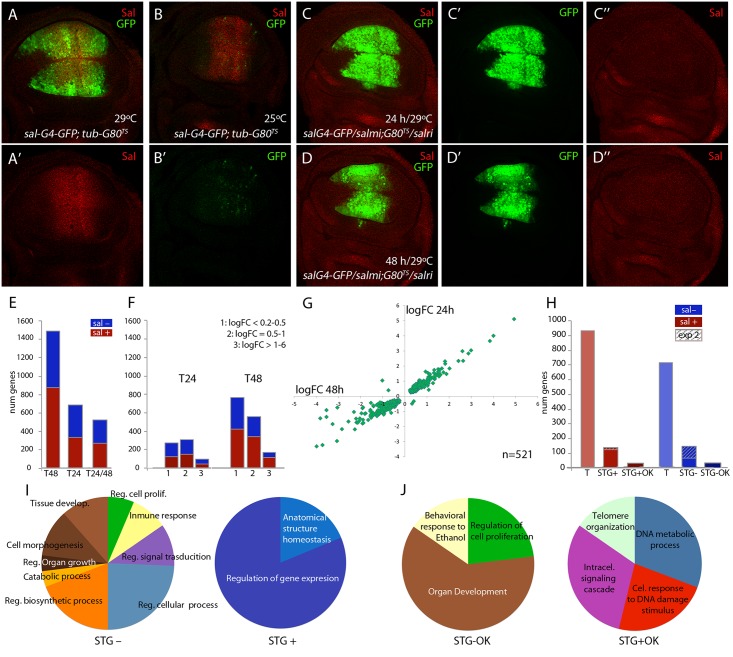
Fig 1. Global results of the genome-wide transcriptional changes observed in wing discs with reduced expression of salm and salr.
(A-A’) Expression of Salm (red in A and A’) and sal EPv -Gal4 (green in A) in sal EPv -Gal4 UAS-GFP; tub-Gal80 ts /UAS-GFP wing discs raised at 29°C. (B-B’) Expression of Salm (red in B) and sal EPv -Gal4 (green in B’) in sal EPv -Gal4 UAS-GFP; tub-Gal80 ts /UAS-GFP wing discs raised at 25°C. (C-C’’) Imaginal disc of sal EPv -Gal4 UAS-GFP /UAS-salm-i; tub-Gal80 ts /UAS-salr-i genotype (salm-i/salr-i 24h) raised at 29°C 24–28 hours before dissection, showing the expression of GFP (green in C and C’) and Salm (red in C and C’’). (D-D’’) Imaginal disc of sal EPv -Gal4 UAS-GFP /UAS-salm-i; tub-Gal80 ts /UAS-salr-i genotype (salm-i/salr-i 48h) raised at 29°C 44–48 hours before dissection showing the expression of GFP (green in D and D’) and Salm (red in D and D’’). (E) Number of genes which expression level changes with an adjusted p-value lower than 0.05 that were identified in the comparisons with controls of salm-i/salr-i at 48h (T48); salm-i/salr-i at 24h (T24) and at both time intervals (T24/T48). The blue and red sections of each column correspond to genes showing reduced (sal-; blue) and increassed (sal+; red) expression in salmi/salri compared to their corresponding controls. (F) Number of genes identified at T24 and T48 grouped by logFoldChange values. Blue represents genes which expression is reduced and red those genes which expression is increased. 1: logFC lower than 0.5; 2: logFC between 0.5 and 1 and 3: logFC major than 1. (G) Graphical representation of the logFoldChange values for those genes that were identified both in salm-i/salr-i 48h and salm-i/salr-i 24h. (H) Total number of identified genes from experiment 1 (T) with increased (sal+; red) and reduced (sal-; blue) expression in salm-i/salr-i discs compared to controls. Number of selected genes coming from experiments 1 and 2 (STG) with increased (STG+) and reduced (STG-) expression. Genes selected from experiment 2 are indicated by stripped columns. Number of best candidate sal repressed (STG+OK) and activated (STG-OK) genes. (I-J) Number of genes grouped in GO categories enriched for STG- and STG+ genes (I) and for STG-OK and STG+OK genes (J).

