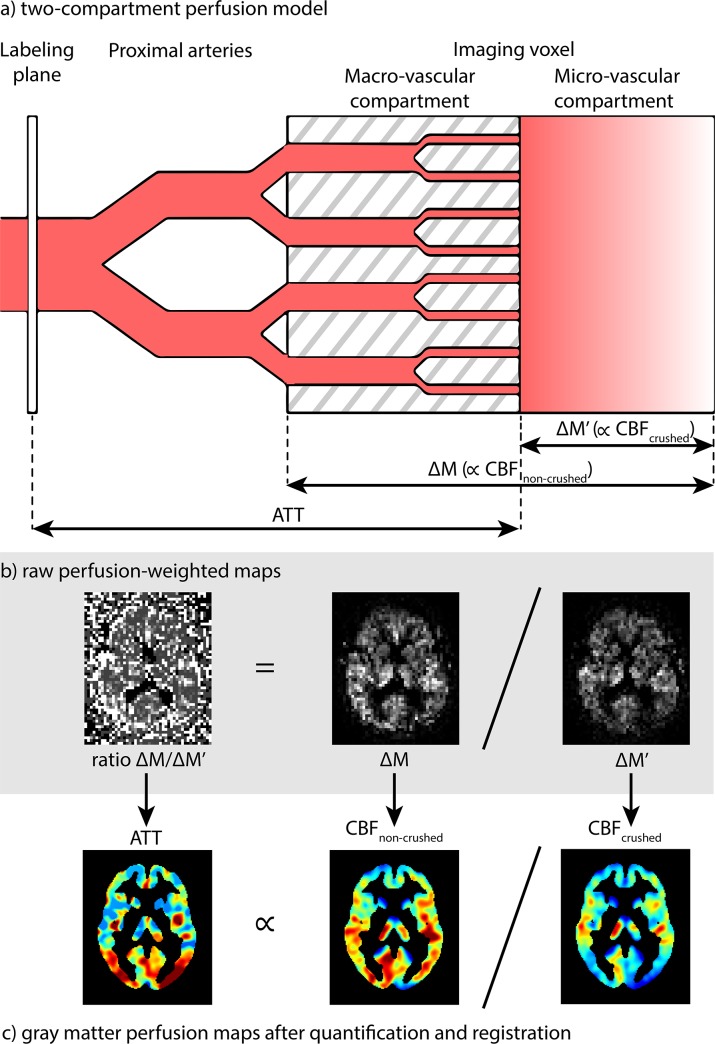
Fig 1.
a) Schematic overview of the two-compartment perfusion model explains the FEAST technique, adapted from Wang et al. [6] b) shows raw perfusion-weighted maps and c) perfusion maps after post-processing for a representative subject. Note that the signal intensity is lower after crushing (ΔM') than before (ΔM) and that crushed CBF (CBFcrushed) is weighted toward the micro-vascular CBF whereas non-crushed CBF (CBFnon-crushed) is weighted toward both micro- and macro-vascular CBF. ATT = arterial transit time, ∝ = proportional to.

