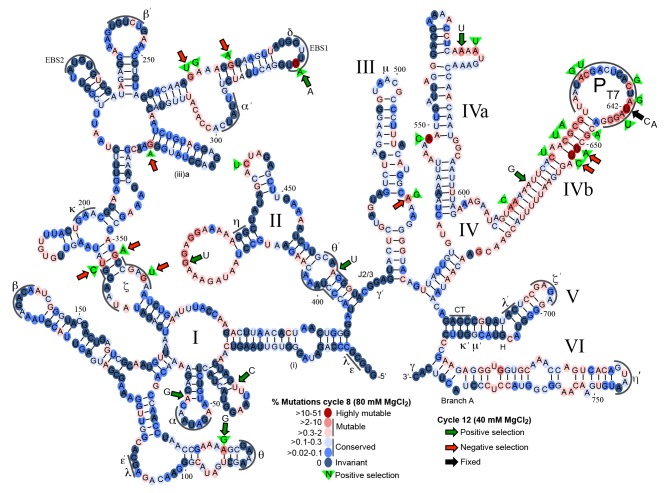
Fig 7. Mutational fitness map of the Ll.LtrB intron during directed evolution in human cells.
Secondary structure diagram of the Ll.LtrB intron showing mutation frequencies based on Pacific Biosciences RS circular consensus sequencing after 8 and 12 cycles of directed evolution in HEK-293 cells in culture medium supplemented with 80 mM or 40 mM MgCl2. Round 8 was assessed with 1,395 full-length reads, with the results presented as a color-coded heat map on a secondary structure diagram of the Ll.LtrB intron. Dark to light blue ovals represent conserved nucleotide positions with mutations present in 0–0.3% of the population. Pink to red ovals indicate mutable nucleotide positions with mutations present in >0.3–60% of the population. Green triangles with nucleotide inscribed, indicate positive selection in rounds 1–8 with the indicated nucleotide comprising >80% of the mutations at that position. Round 12 was assessed with 3,069 full-length reads with large colored arrows indicating positions at which the indicated mutation increased (green arrows) or decreased (red arrows) in frequency by >2-fold in round 12 after selection at 40 mM Mg2+ relative to round 8 after selection at 80 mM Mg2+. The black arrow at position 642 indicates that the mutations shown at this position were fixed in 99% of the population in round 12. Greek letters with sequence delineated below indicate motifs involved in long-range tertiary structure interactions.

