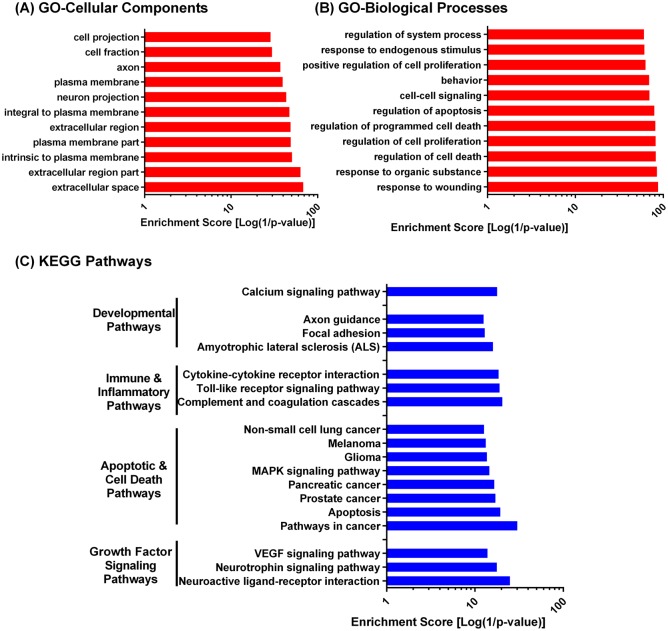
Fig 2. Functional annotation of the SCI meta-proteome.
Enriched GO cellular components (A), GO biological processes (B), and KEGG pathways (C). Terms restricted to most significantly enriched terms (p-value <1E-10). For clarity of presentation, enrichment scores were reported as log (1/p-value). Full list of DAVID enrichment analysis is available in S4, S5 and S6 Tables.

