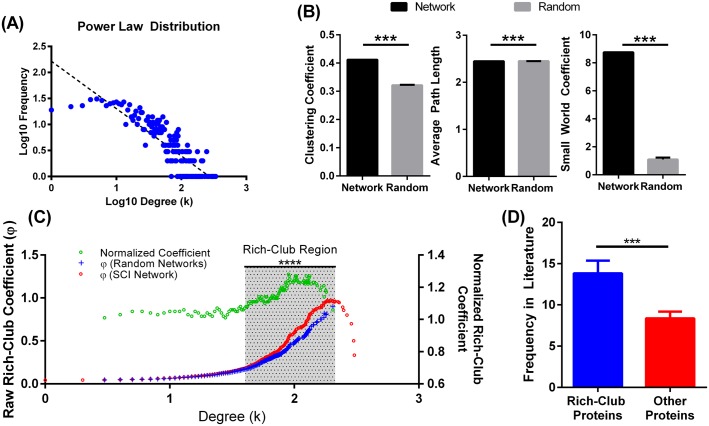
Fig 3. Network properties of the SCI interactome.
(A) Power-Law distribution of nodes in the SCII showing a pattern typical of a scale free network: High frequency of non-hub nodes (nodes with few connections) and low frequency of hubs (nodes with high connections). (B) Detection of rich-club organization in the SCII. As described in methods, rich-club coefficient (φ(k)) was computed across the range of degrees in the network and compared to the rich-club coefficient (φ¬random(k)) of 1000 comparable random networks. Raw rich-club coefficient measures mapped to right vertical axis. Normalized coefficient mapped to the left vertical axis. A normalized coefficient > 1 indicates an RC organization. One sample t-test, ****average p-value = 2 E-12. (D) Frequency in literature of rich-club vs. non-rich-club proteins. Mean +/- SEM. Student t-test. *** p<0.0001.

