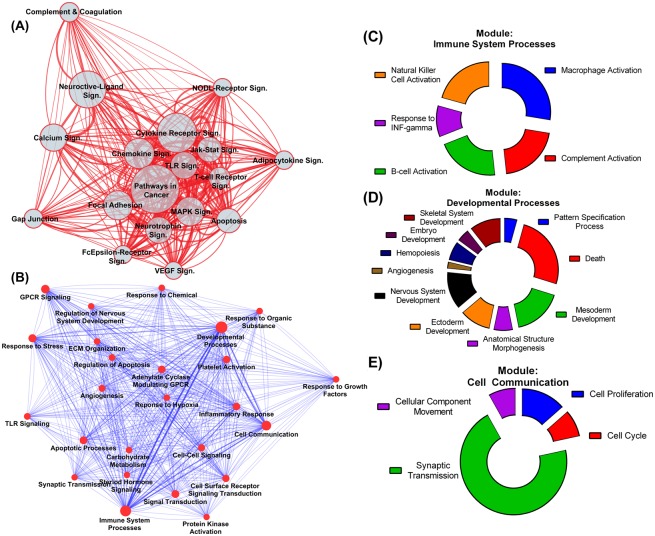
Fig 4. Interaction networks of rich-club pathways and modules.
(A) Network of interacting pathways among rich-club nodes. Visualized pathways are those with an over-representation p-value <1E-10. Node size (circles) are mapped to the number of nodes within each pathway while the edge width is mapped to the number of interactions among components of the corresponding pathways. The network is shown as a weighted layout with pathways densely interconnected are clustered together. Enrichment statistics are shown in S9 Table. Sign = Signaling. (B) Rich-club modules enriched for specific GO biological processes. Network style and layout is similar to (A). S1 File allows for exploring the different subnetworks for each module in addition to the enrichment statistics and the number of genes within each pathway. Weighted node-specific degrees for the different modules is available in S9 Table. (C-E) Detailed gene distribution within the most over-represented GO biological processes for select modules with highest weighted node-specific degrees; immune system processes (C), developmental processes (D) and cell communication (E).

