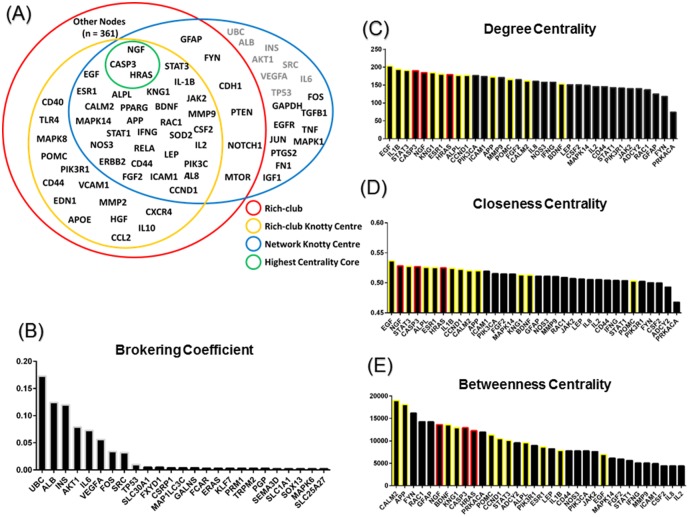
Fig 6. Centrality measures for individual nodes in the SCI meta-proteome.
(A) Distribution of protein nodes among the network topological features. Rich-club in red, rich-club knotty centre in gold, network knotty centre in blue and the highest centrality core in green. The highest centrality core includes three nodes that scored more than two standard deviations above average on three different centrality measures. In grey are top brokers in the network. (B) Brokering coefficients for top brokers in the network. Grey border indicates top broker nodes in the network. (C-E) Distribution of nodes by centrality measures. Visualized are nodes having the top 34 scores on three centrality measures (degree centrality, closeness centrality and betweenness centrality. Yellow border indicates nodes that are two standard deviations above average of two different centrality measures. Red border indicates nodes that are two standard deviations above average of all three different centrality measures.

