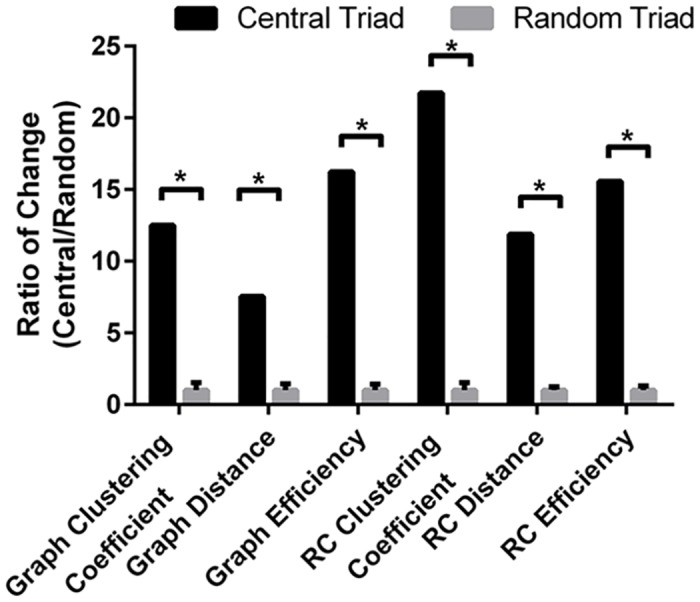
Fig 7. Effect of removing central triad compared to random triad removal on network and rich-club graph measures.

Central triad (Neuronal Growth Factor, H-Ras, and Caspase-3). Plotted is the ratio of change caused by central triad removal compared to change induced by random triad removal. Mean +/- SEM. One sample t-test. * p<0.05.
