
Figure 5. CUR reduced the protein expression of DNMTs in HT29 cells.
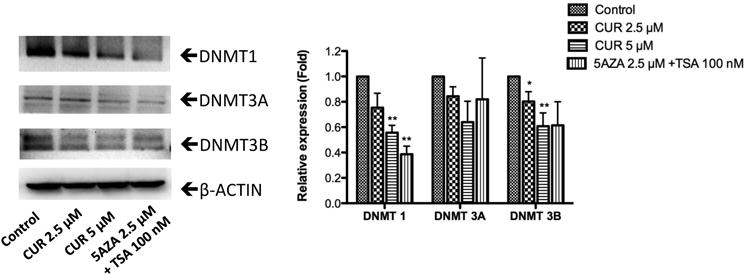
Proteins were extracted and examined by western blotting. The fold relative expression was calculated by dividing the intensity of each sample by that of the control sample and then normalizing to the intensity of β-actin using ImageJ. Representative bands are shown in the left panel. The bar chart in the right panel presents the mean ± SEM of three independent experiments. * P<0.05 versus the control group, ** P<0.01 versus the control group.