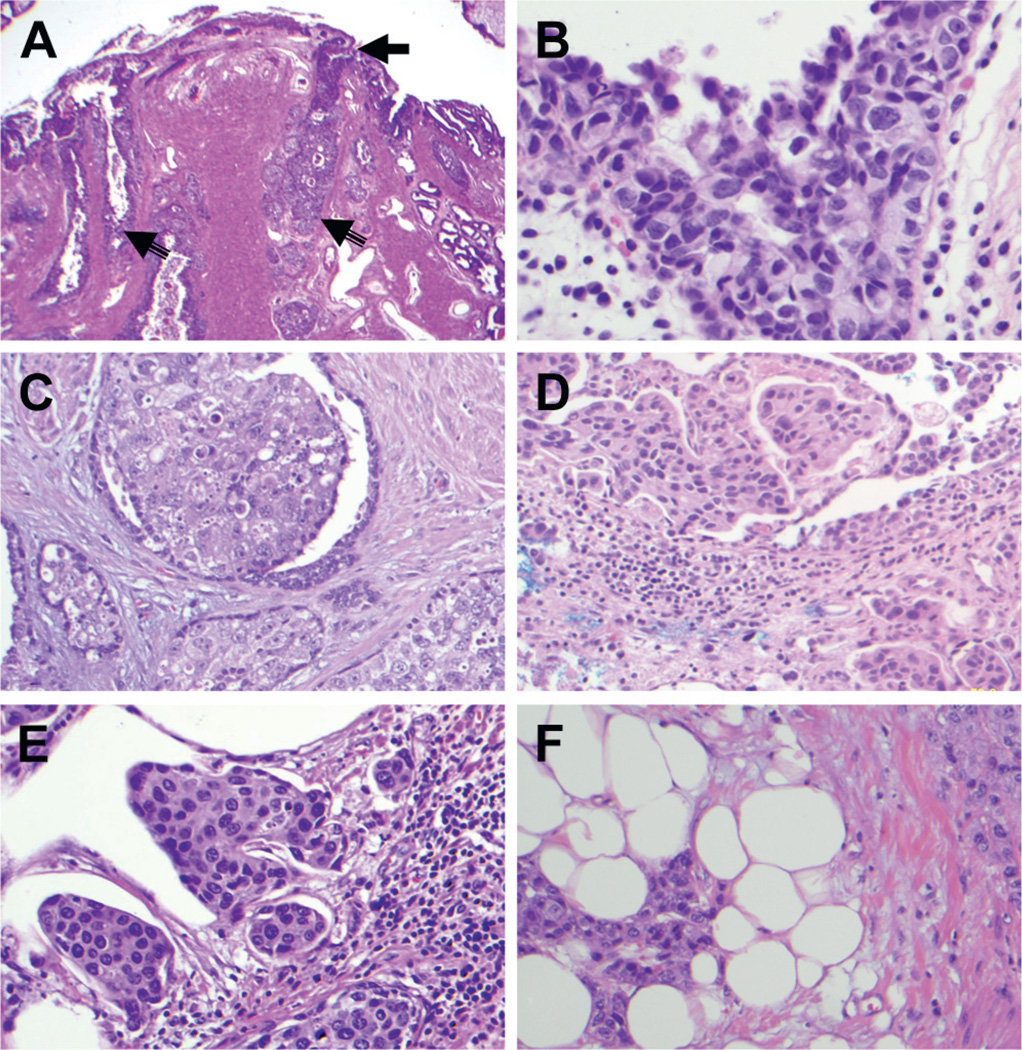
Figure 3.
Prostatic urothelial carcinoma patterns and levels. A, low power view shows prostatic verumontanum with urethral and ductal CIS (arrows). Reduced from ×20. B, prostatic urethral CIS with pagetoid spread. Reduced from ×400. C, prostatic ductal CIS spread with intact ductal epithelium. Reduced from ×400. D, superficial lamina propria invasion by prostatic urothelial carcinoma. Reduced from ×200. E, prostatic stromal invasion with nests and single tumor cells invading dense prostatic stromal tissue with inflammatory infiltrates. Reduced from ×200. F, periprostatic invasion by urothelial carcinoma with nests of tumor cells infiltrating adipose tissue. Reduced from ×200.

