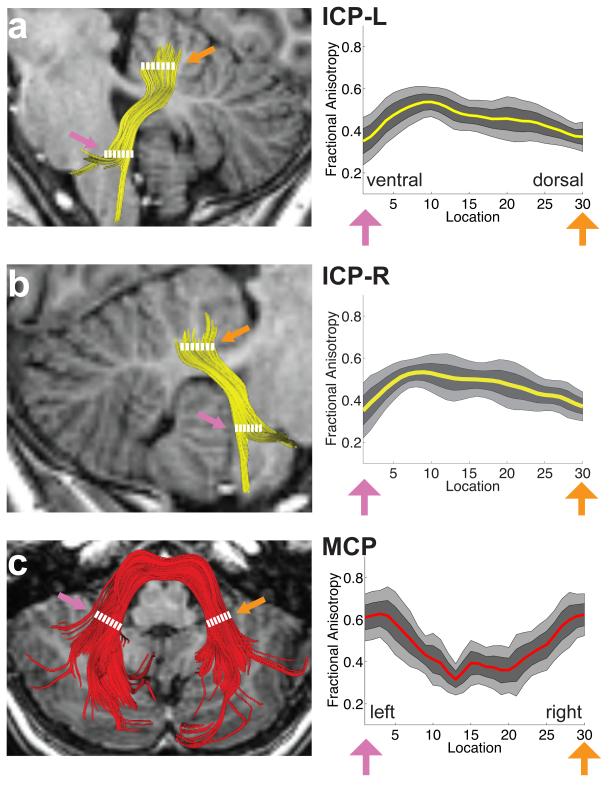
Figure 3.
FA tract profiles of the inferior and middle cerebellar peduncles in the sample of children and adolescents (N=19 ICP; N=18 MCP). Left hand column (A-C) shows renderings of 3 individual cerebellar tracts on sagittal (A,B) or axial (C) T1 images in the same representative subject shown in Figure 2. Right hand columns show FA tract profiles that are color-coded to match tract renderings in adjacent T1 images for the left (A) and right (B) ICP and MCP (C). FA values are plotted for 30 equidistant locations between two defining ROIs as indicated by dashed white lines. Location of ROIs correspond to pink and orange arrows in tract profiles. Boundaries of the 25th and 75th percentiles are indicated by dark gray shading. Boundaries of the 10th and 90th percentiles are indicated by light gray shading. (ICP = inferior cerebellar peduncle; MCP = middle cerebellar peduncle; L = left; R = right).

