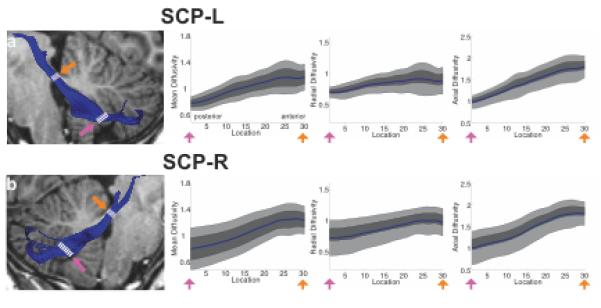
Figure 6.

Group and individual variance in Tract FA profiles. Group mean FA for the normative group is plotted for each tract for 3 locations corresponding to the average FA from nodes 1-10, 11-20, and 21-30 respectively (a-e). Error bars represent ±1 standard deviation of the normative group mean. (ICP = inferior cerebellar peduncle; MCP = middle cerebellar peduncle; SCP = superior cerebellar peduncle; L = left; R = right).
