
Table 1. Dermographic data for the EEM and control groups.
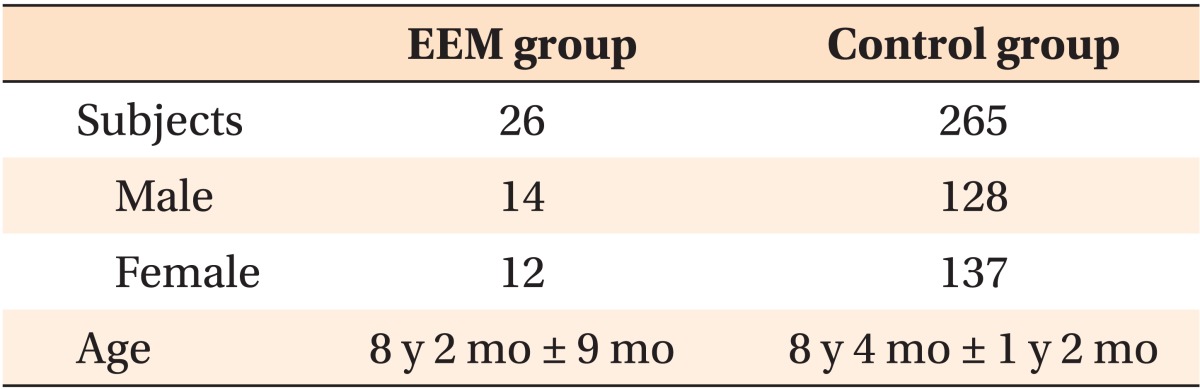
Values are presented as number or mean ± standard deviation.
EEM, Ectopic eruption of the permanent maxillary first molar; y, years; mo, months.
Official websites use .gov
A
.gov website belongs to an official
government organization in the United States.
Secure .gov websites use HTTPS
A lock (
) or https:// means you've safely
connected to the .gov website. Share sensitive
information only on official, secure websites.
Values are presented as number or mean ± standard deviation.
EEM, Ectopic eruption of the permanent maxillary first molar; y, years; mo, months.