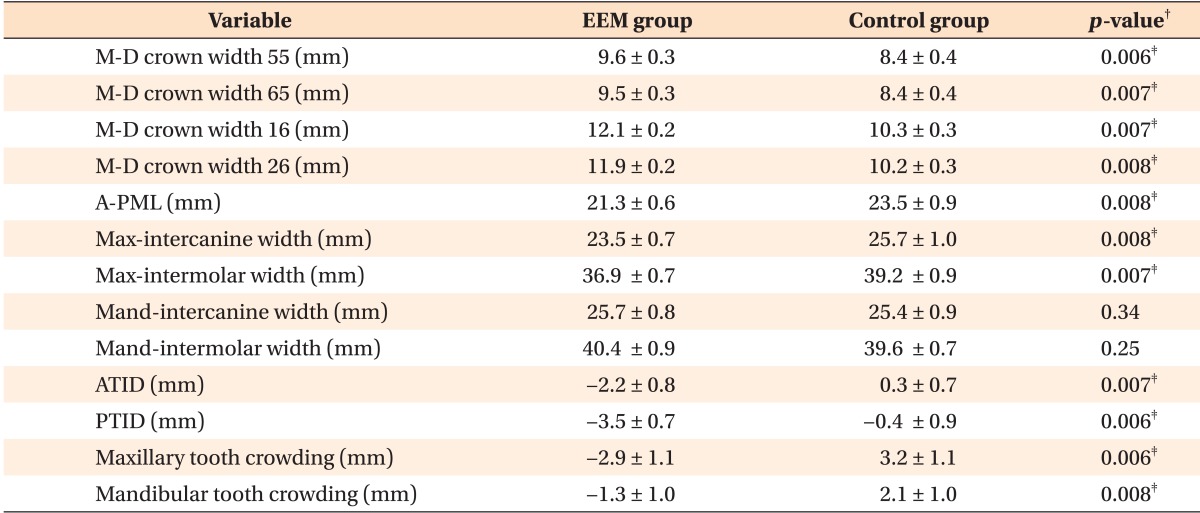
Table 2. Statistical analysis of the EEM and control groups*.

*Descriptive statistics and statistical comparisons of dental characteristics, maxillomandibular transverse skeletal relationships, and tooth crowding between the EEM and control groups.
Values are presented as mean ± standard deviation.
EEM, Ectopic eruption of the permanent maxillary first molar; M-D crown widths, mesiodistal crown widths; A-PML, anteroposterior maxillary length; Max-intercanine width, maxillary intercanine width; Max-intermolar width, maxillary intermolar width; Mand-intercanine width, mandibular intercanine width; Mand-intermolar width, mandibular intermolar width; ATID, anterior transverse interarch discrepancy; PTID, posterior transverse interarch discrepancy.
†Independent t-test; ‡p < 0.01.
