Figure 2.
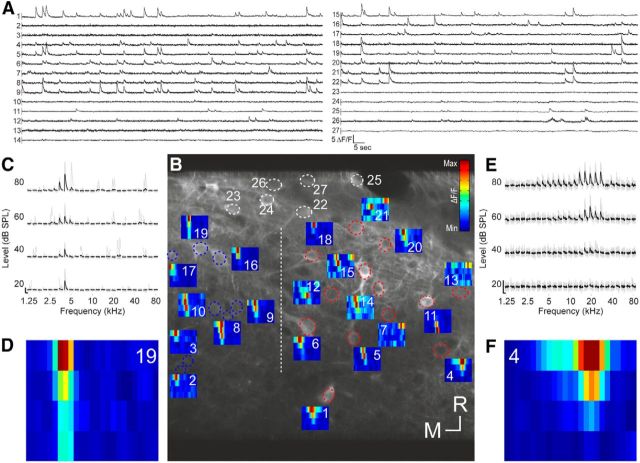
Tone-evoked calcium responses of IC neurons in one imaging area. A, Fluorescence traces of all 27 neurons that were identified in this imaging area. B, Micrograph of the imaging area (200 × 200 μm) with ROIs drawn as dotted ellipsoids. ROIs marked in white indicate nonresponsive neurons. All other ROIs are color-coded according to the results of a SVM classification (see main text; blue, CNIC; red, DCIC). All CNIC neurons were found to the left of the dashed vertical line, all DCIC neurons were found to the right of the line. FRAs are depicted next to each responsive neuron. Scale bar, 10 μm. C, Fluorescence traces of neuron 19 ordered according to sound frequency and level. The nine traces associated with the nine repeats of each stimulus are plotted in gray. The average calcium signals are plotted in black. Scale bars indicate 2 ΔF/F and 1 s, respectively. D, FRA corresponding to C. E, F, Fluorescence traces and FRA for neuron 4, plotted as in C and D. R, Rostral; M, medial.

