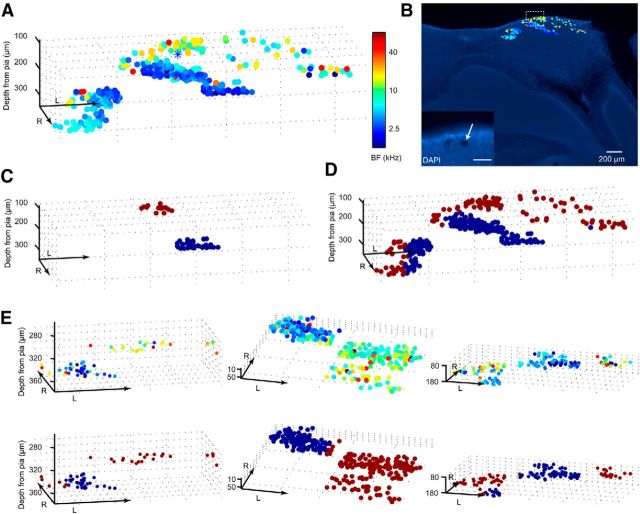
Figure 3.
Functional distribution of BFs within the IC. A, The relative spatial locations of 322 tone-responsive neurons from one animal were reconstructed in 3D space and color-coded according to each neuron's BF. Blue asterisk marks the coordinates of a laser ablation made at the end of this experiment. B, DAPI staining of the histological section that includes the site of the laser lesion (see inset). Scale bar, 50 μm. All neurons from A are superimposed onto this section, color-coded according to their BFs. C, Two representative imaging areas from this animal, one putatively DCIC (dark red), the other putatively CNIC (blue), were used to train a SVM. D, Using this SVM to classify the rest of the neurons from this animal segregates the data into putative DCIC (dark red) and CNIC (blue) areas. E, The same SVM classifier constructed using data from this animal was also used on all other animals. Representative examples from three other animals show the spatial distribution of neurons' BFs (top) and the results of the SVM classification (bottom). R, rostral; L, lateral. Axis arrow length, 200 μm. “Depth from pia” indicates the depth in micrometers relative to the tip of the IC. Note that due to the curvature of the IC the actual distance to the pia may be smaller for imaging areas at some x–y distance away from the tip.

