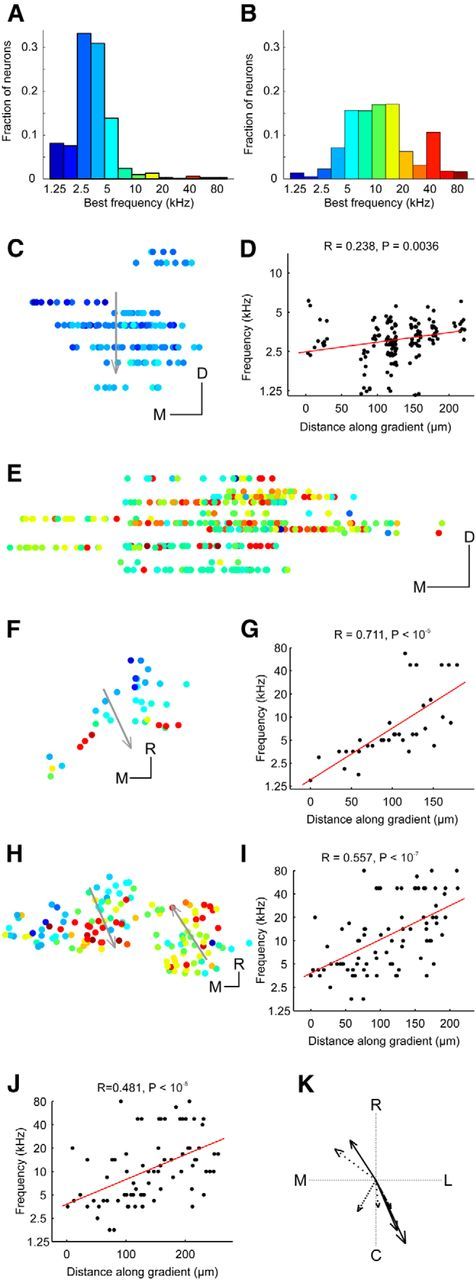
Figure 4.

Tonotopic arrangement in the DCIC and upper CNIC. A, Histogram of BFs for upper CNIC neurons. B, Histogram of BFs for DCIC neurons. C, Location of upper CNIC neurons in one example animal color-coded by BF and collapsed onto the same coronal plane. D, BF plotted against distance along the dorsoventral axis indicated by the arrow in C. To improve visibility data points have been jittered in the x and y dimension by up to 15 μm and 0.125 octaves, respectively. Red line shows linear fit to nonjittered data. Four outliers with BFs of >10 kHz were excluded from C and D. E, Location of DCIC neurons in one example animal color-coded by BF and collapsed onto the same coronal plane to show variation in BF with depth. F, Location of DCIC neurons from one example animal color-coded by BF and collapsed onto the same horizontal plane. G, BFs plotted against distance along the tonotopic axis indicated by the arrow in F. H, Location of DCIC neurons from another example animal color-coded by BF and collapsed onto the same horizontal plane. I, BFs plotted against distance along the tonotopic axis indicated by the left arrow in H. J, BFs versus the distance along the tonotopic axis indicated by the right arrow in H. K, Directions of tonotopic gradients found in the DCIC of different animals (in one case, shown in H, two opposing frequency gradients were found). The arrow length is proportional to the R value of the projection. The line style indicates the P index (not corrected for multiple comparisons): solid (p < 10−5), dashed (p < 10−4), dotted (p < 0.001), and sparsely dotted (p < 0.01). C, Caudal; R, rostral; L, lateral; M, medial. Scale bars, 50 μm.
