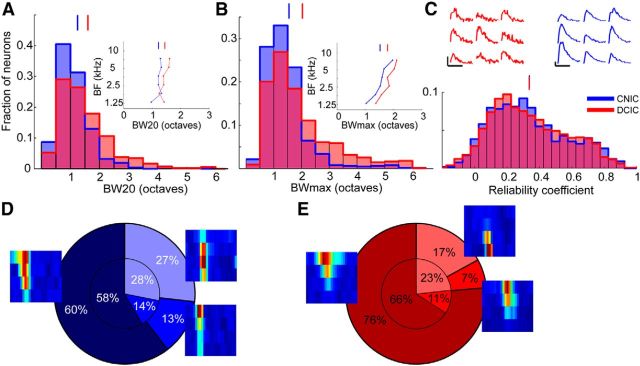
Figure 5.
Receptive field properties of DCIC and CNIC neurons. A, Histogram of BW20. Inset, The mean BW20 as a function of the neurons' BF. B, Histogram of BWmax. Inset, The mean BWmax as a function of the neurons' BF. C, Histogram of reliability coefficients. Upper fluorescence traces (red) show the responses evoked by nine presentations of the best stimulus for a DCIC neuron (same as in Fig. 2E,F). Reliability coefficient = 0.671. Upper fluorescence traces (blue) show the responses evoked by nine presentations of the best stimulus for a CNIC neuron (same as in Fig. 2C,D). Reliability coefficient = 0.740. D, Pie chart of FRA shapes of CNIC neurons. The slices indicate (clockwise) the proportion of O-shaped, I-shaped, and V-shaped FRAs. The small pie chart indicates the proportions of FRA shapes for neurons with BFs of ≤8.4 kHz. The proportions were calculated separately for half-octave wide BF bins and then averaged. E, Same as D for DCIC neurons. Examples for each type of FRA are also plotted next to the corresponding region of the pie charts. Vertical lines above histograms indicate means.

