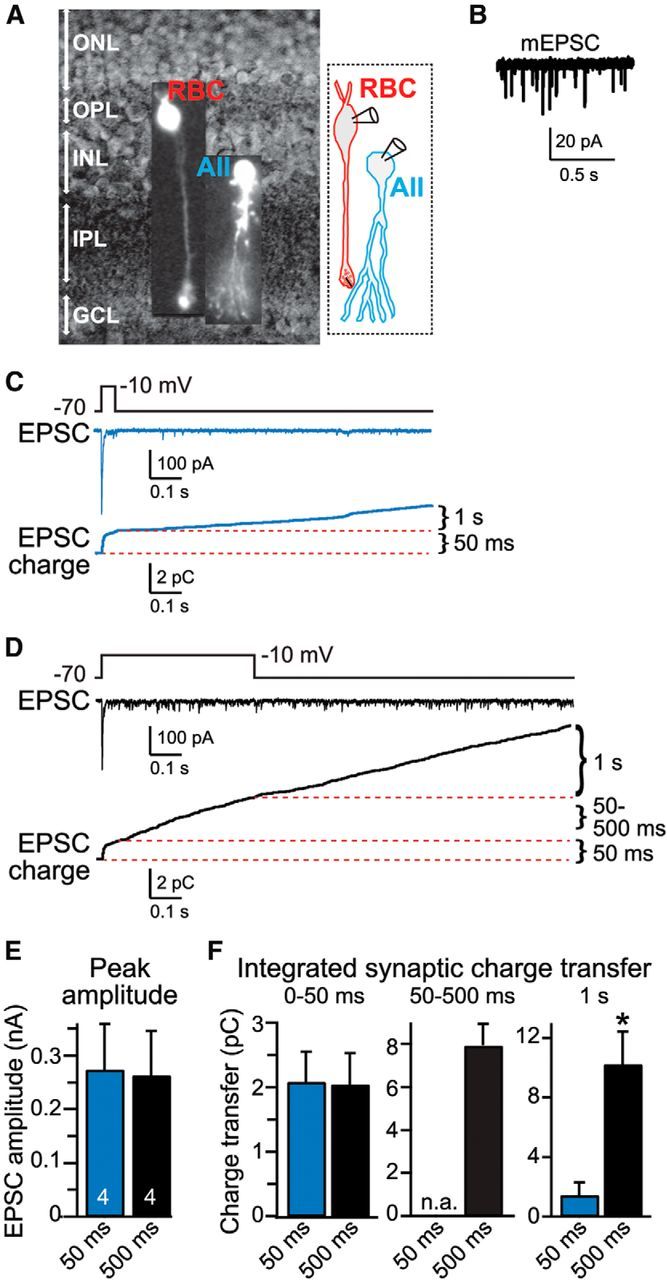
Figure 1.

Paired recordings of synaptic transmission at RBC–AII cell synapses. A, Left, Retinal slice visualized with IR-DIC optics with superimposed images of an RBC and an AII cell that are labeled fluorescently by Alexa Fluor-594. Right, Schematic of a synaptic connection between an RBC and an AII cell. GCL, Ganglion cell layer; INL, inner nuclear layer; IPL, inner plexiform layer; ONL, outer nuclear layer; OPL, outer plexiform layer. B, Representative trace of spontaneous mEPSCs recorded from an AII cell. C, D, Representative traces of EPSCs recorded from AII cells as a function of 50 ms (C) or 500 ms (D) duration step depolarizations of the presynaptic RBC (top, presynaptic depolarization protocol; middle, postsynaptic EPSCs; bottom, plots of the cumulative EPSC charge transfer). The three time periods analyzed for quantifying release (50 ms, 50–500 ms, and 1 s after repolarization) are illustrated in the cumulative charge graphs. Recordings were performed in standard bath solution containing 2 mm Ca2+ and 1 mm Mg2+ with an internal pipette solution containing 1.3 mm BAPTA to mimic the endogenous Ca2+-buffering capacity of RBCs. E, Summary graph of the peak EPSC amplitude during the initial transient EPSC phase shows that this amplitude is independent of the length of the depolarization pulse. F, Summary graphs of the EPSC charge transfer during the initial 50 ms of depolarization (fast release), the 50–500 ms depolarization period for the longer pulse (sustained release), and the 1 s after the depolarization (delayed asynchronous release). Note that delayed asynchronous release is approximately fivefold larger after the 500 ms pulse than after the 50 ms pulse. All data are means ± SEMs (n = 4). Statistical analyses were performed by Student's t test comparing the 50 and 500 ms depolarization pulses. *p < 0.05.
